AI-Assisted Hybrid Network SOC Lab
Project overview
What is happening?
I decided to simulate a small company with an internal application that runs in AWS.
I had learned about the tools in isolated labs but had never done anything that simulated a real environment. That is the goal of this lab.
Firstly, I did not use Docker Compose because it does not allow you to easily create connections. For example, in Containerlab I can do this:
Specify interfaces between endpoints.
Here, I know that the core-router’s eth1 is connected to the firewall’s eth1. There is no ambiguity.
links:
  - endpoints: ["core-router:eth1", "firewall:eth1"]
  - endpoints: ["firewall:eth2", "server:eth1"]
  - endpoints: ["core-router:eth2", "user-host:eth1"]
The first point of annoyance for me was the fact that most OS images are written for x86. I decided to do this project on an M1 Mac because, well, it’s my main computer and I wanted to do it here if possible. But several limitations stopped me:
- I only had 8 gigs of RAM.
- I conveniently had a laptop with Linux already installed on it and 32 gigs of RAM.
The last point was what sealed the deal for me. I ended up using SSH to connect to my laptop using public key authentication. I did not really want to enter the password every time, and public key authentication is also more secure. So I ended up going with that.
Network architecture
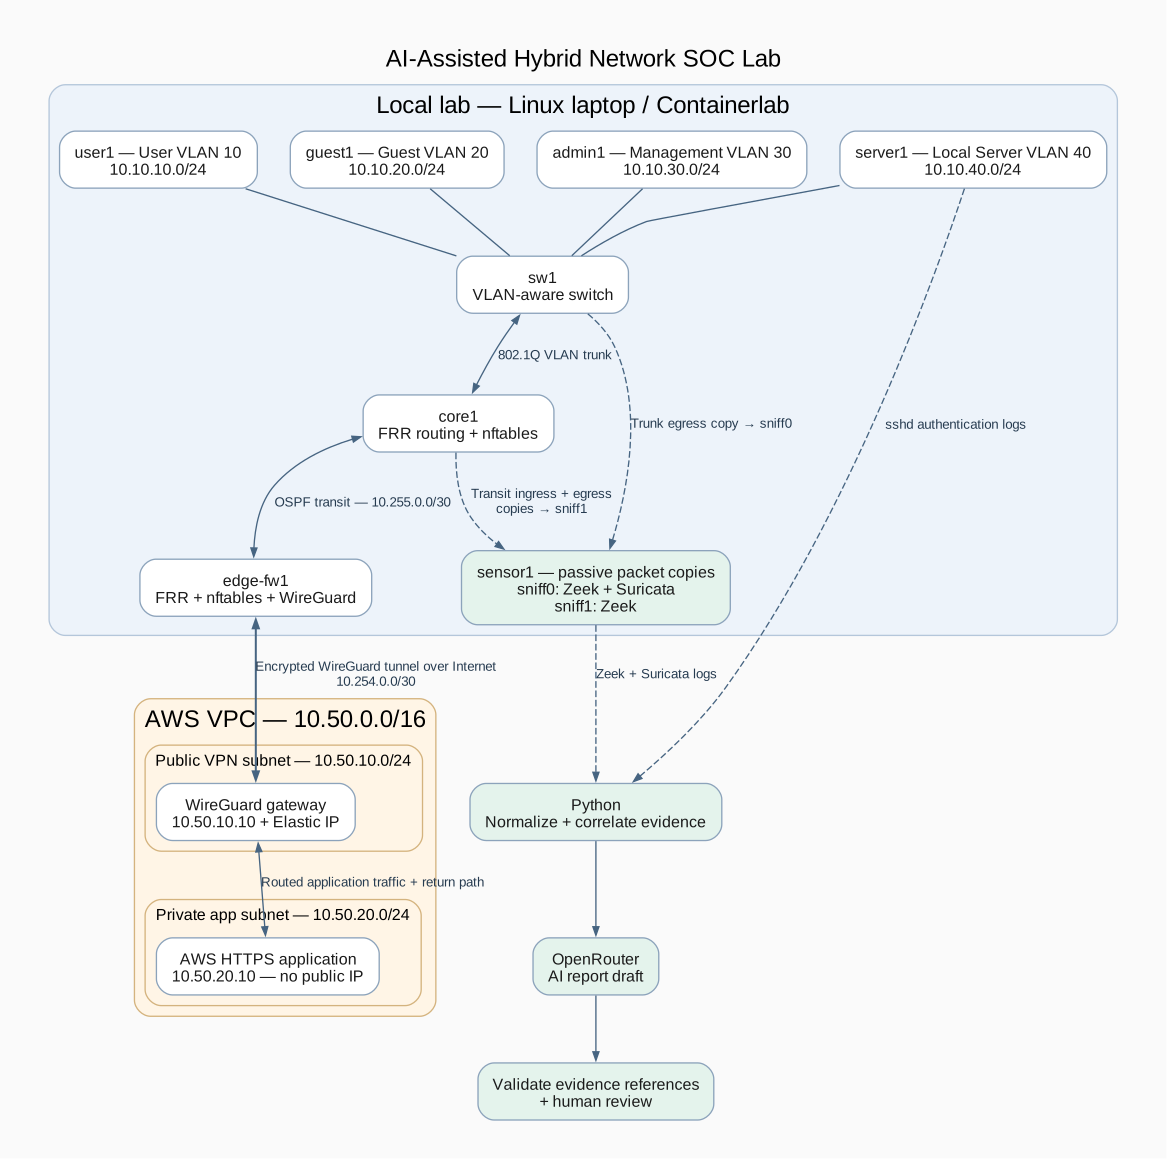
View diagram source
flowchart LR
    subgraph LOCAL["Local lab — Linux laptop / Containerlab"]
        USER["user1 — User VLAN 10<br>10.10.10.0/24"]
        GUEST["guest1 — Guest VLAN 20<br>10.10.20.0/24"]
        ADMIN["admin1 — Management VLAN 30<br>10.10.30.0/24"]
        SERVER["server1 — Local Server VLAN 40<br>10.10.40.0/24"]
        SW["sw1<br>VLAN-aware switch"]
        CORE["core1<br>FRR routing + nftables"]
        EDGE["edge-fw1<br>FRR + nftables + WireGuard"]
        SENSOR["sensor1 — passive packet copies<br>sniff0: Zeek + Suricata<br>sniff1: Zeek"]
        USER --- SW
        GUEST --- SW
        ADMIN --- SW
        SERVER --- SW
        SW <-->|"802.1Q VLAN trunk"| CORE
        CORE <-->|"OSPF transit — 10.255.0.0/30"| EDGE
        SW -. "Trunk egress copy → sniff0" .-> SENSOR
        CORE -. "Transit ingress + egress copies → sniff1" .-> SENSOR
    end
    subgraph AWS["AWS VPC — 10.50.0.0/16"]
        subgraph PUBLIC["Public VPN subnet — 10.50.10.0/24"]
            VPN["WireGuard gateway<br>10.50.10.10 + Elastic IP"]
        end
        subgraph PRIVATE["Private app subnet — 10.50.20.0/24"]
            APP["AWS HTTPS application<br>10.50.20.10 — no public IP"]
        end
        VPN <-->|"Routed application traffic + return path"| APP
    end
    EDGE <-->|"Encrypted WireGuard tunnel over Internet<br>10.254.0.0/30"| VPN
    SENSOR -. "Zeek + Suricata logs" .-> PY["Python<br>Normalize + correlate evidence"]
    SERVER -. "sshd authentication logs" .-> PY
    PY --> AI["OpenRouter<br>AI report draft"]
    AI --> CHECK["Validate evidence references<br>+ human review"]
So the devices would end up being:
├── user1
├── guest1
├── admin1
├── server1
├── sw1
├── core1
├── edge-fw1
└── sensor1
Setting up the Linux laptop
I had a Dell Inspiron 15 with 32 gigs of DDR4 RAM that I had upgraded from 16 gigs back in 2024. In hindsight, that was one of the better decisions I made, considering the RAM pricing trends.
I first had to install an SSH server. I did this using openssh-server:
sudo apt install openssh-server
sudo systemctl enable --now ssh
Then I got its IP address using the hostname command and generated an SSH key on my Mac so I wouldn’t need to enter my password every single time:
ssh-keygen -t ed25519 -a 64 -f ~/.ssh/soc_lab_ed25519 -C "mac-to-soc-lab"Copied the key over to the laptop:
ssh-copy-id -i ~/.ssh/soc_lab_ed25519.pub [email protected]And voilà, I had access to my computer over SSH.
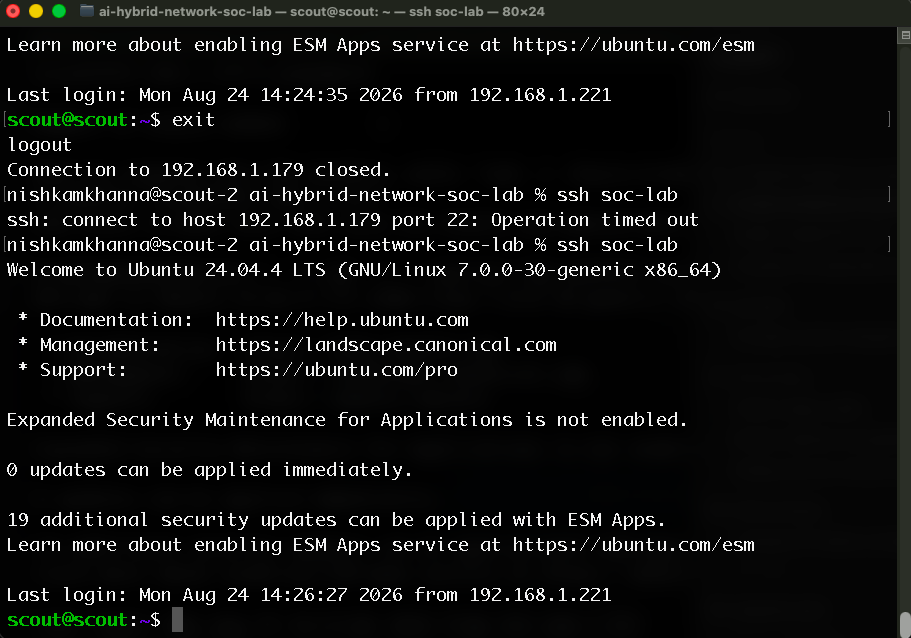
I also added a profile on my Mac at ~/.ssh/config to get into the laptop by simply typing ssh soc-lab. This made things a lot easier for me.
Installing Docker and Containerlab
Finally, I installed Docker and containerd using these commands:
sudo apt install docker-ce docker-ce-cli containerd.io docker-buildx-plugin docker-compose-plugin
sudo systemctl enable docker
sudo docker run --rm hello-world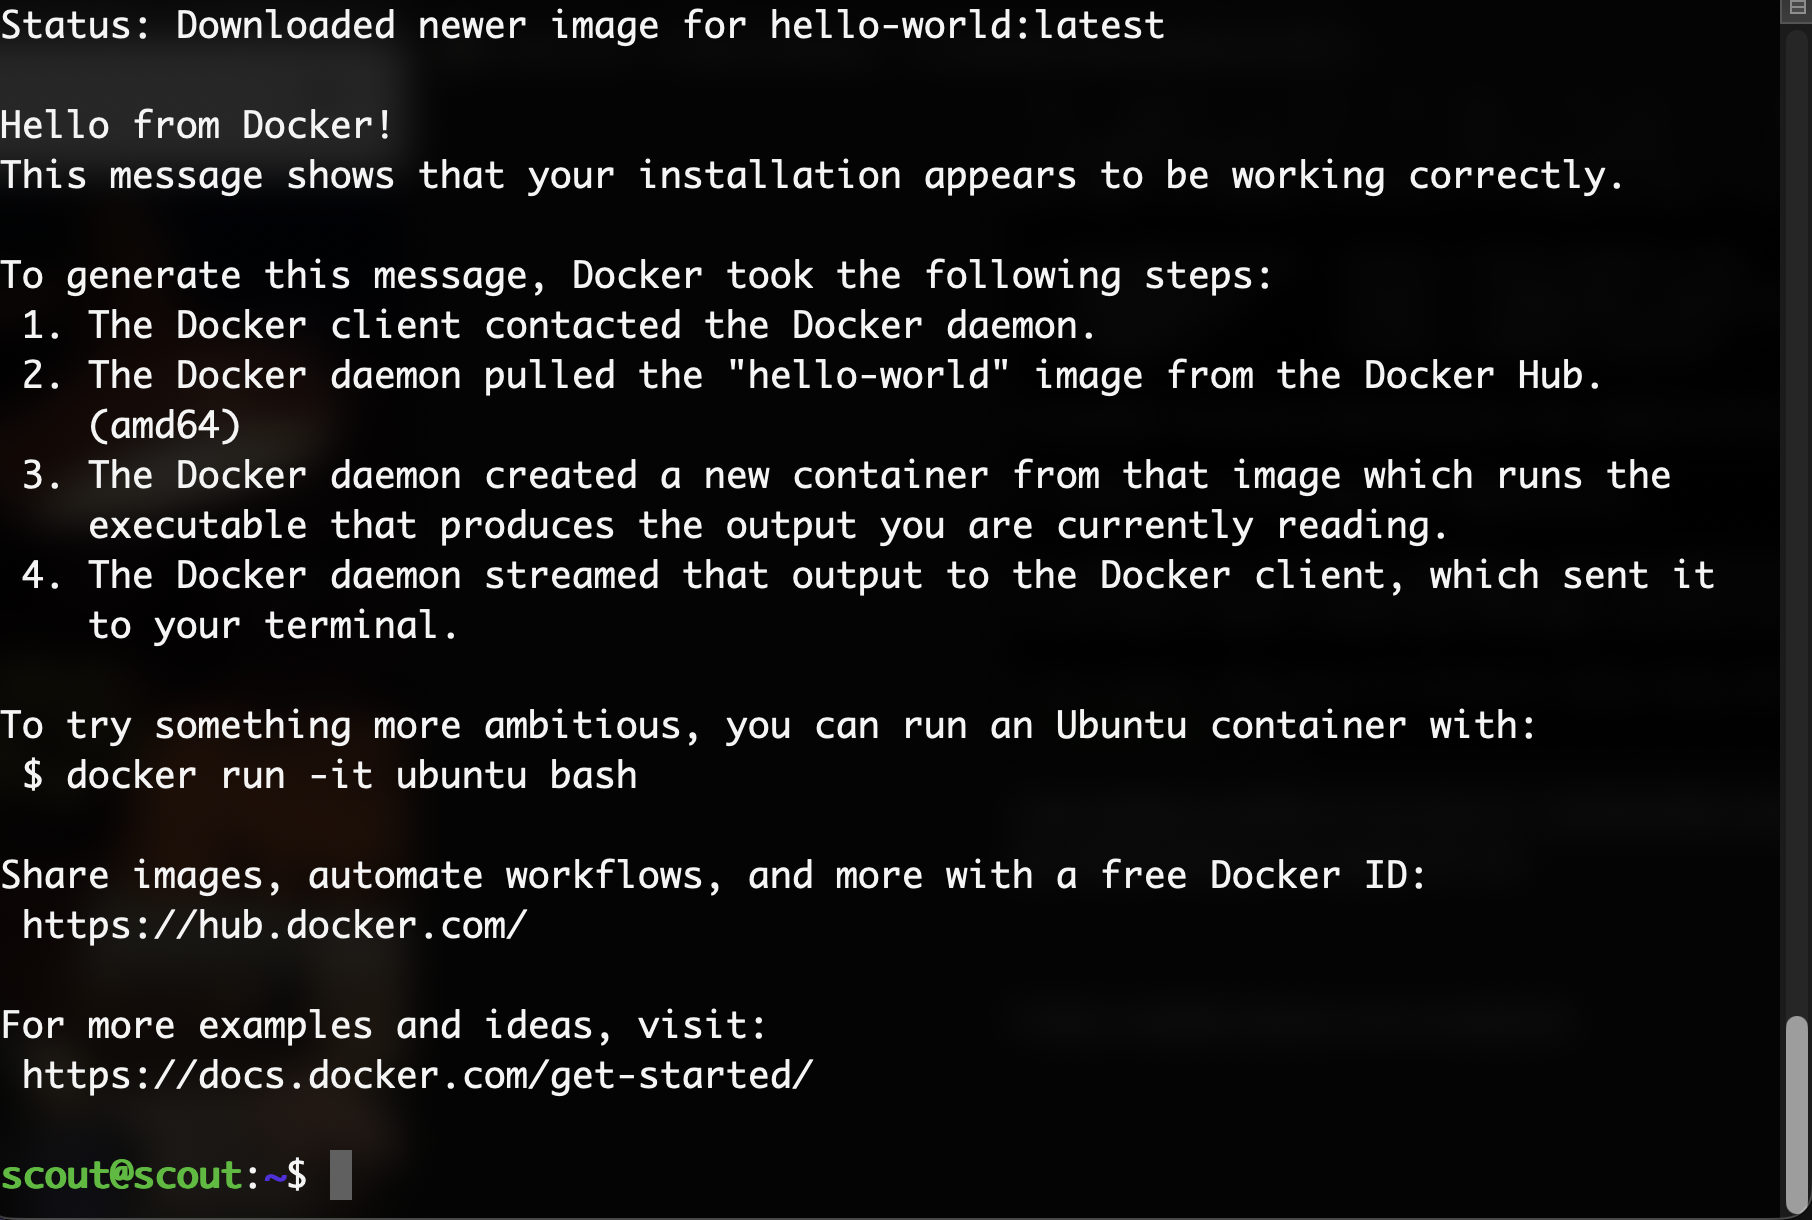
And then Containerlab’s latest version:
sudo apt install ./containerlab_0.77.0_linux_amd64.deb
containerlab version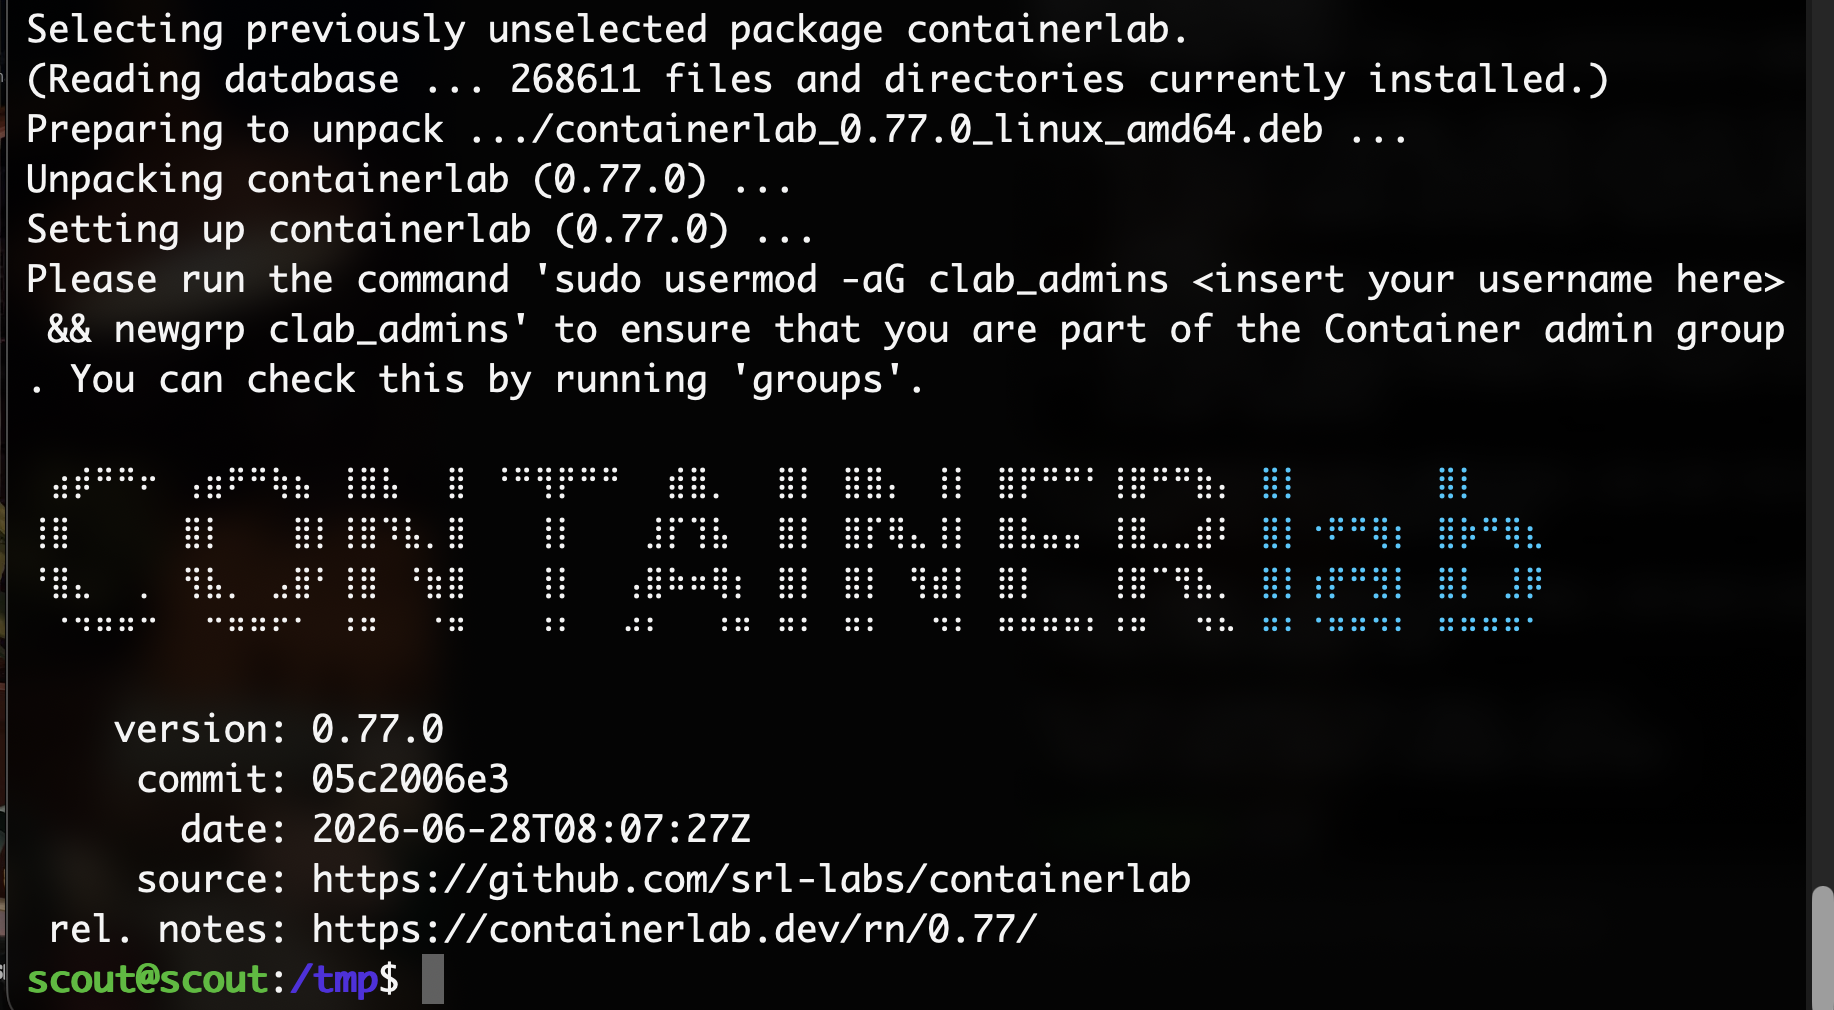
Building the local VLAN network
Then I built the Docker images for the switch and the endpoints.

Writing the Containerlab topology and deploying it:
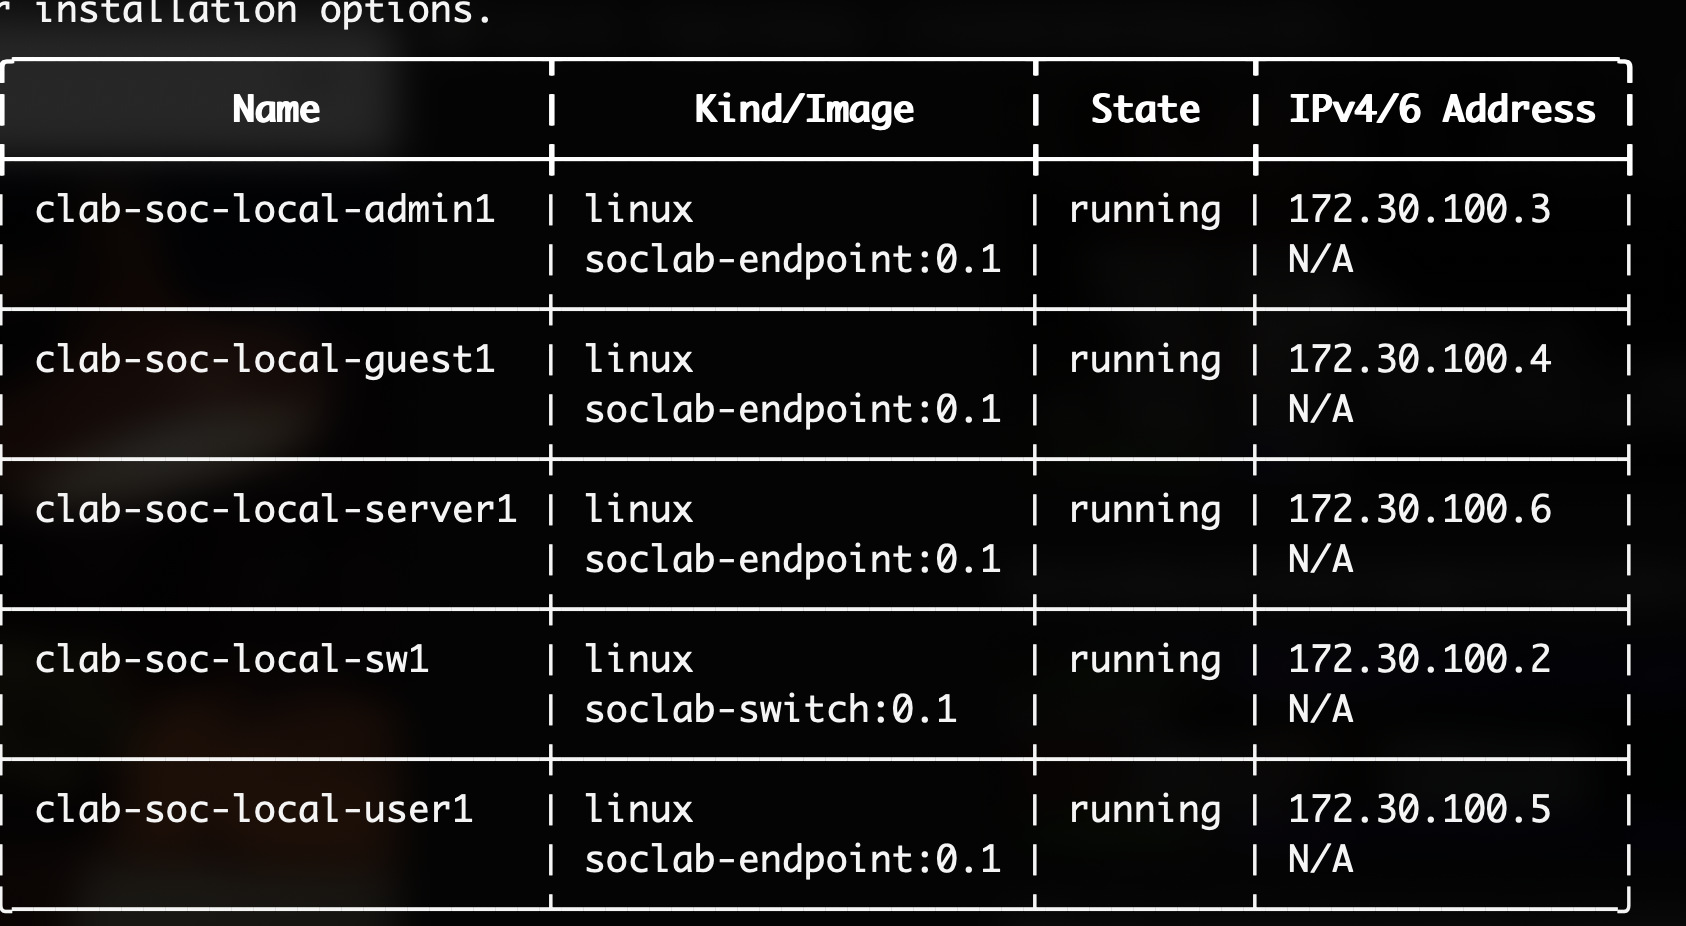
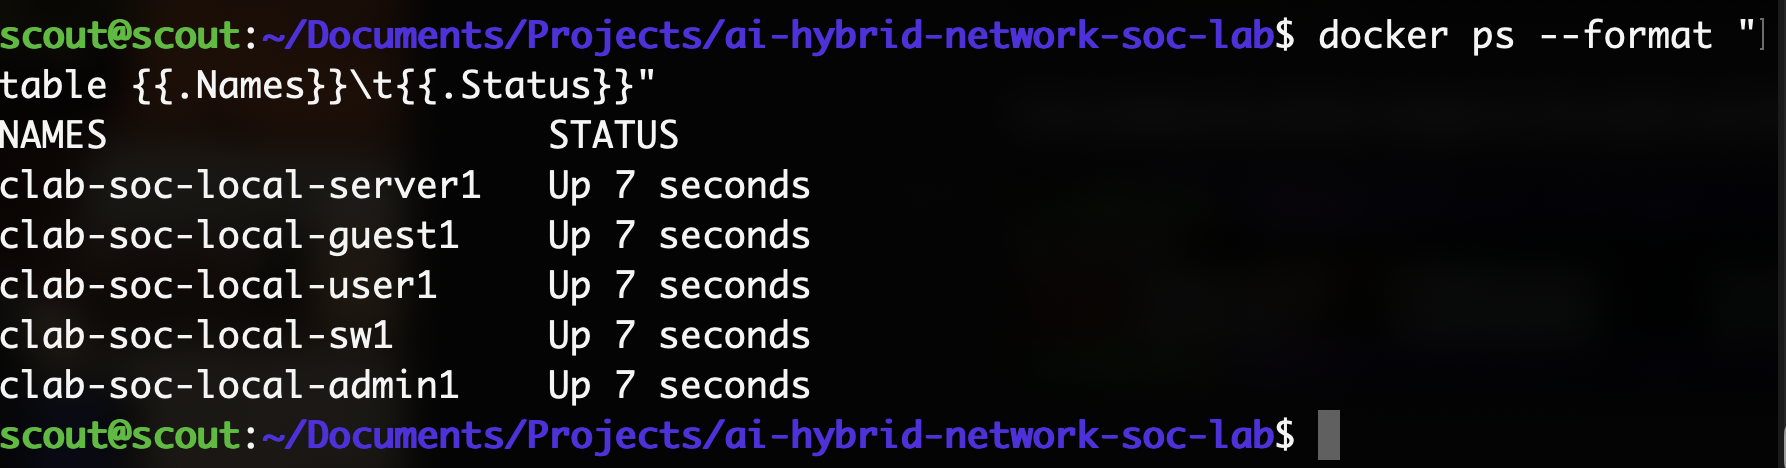
Checking to make sure the images are working:
Testing VLAN isolation
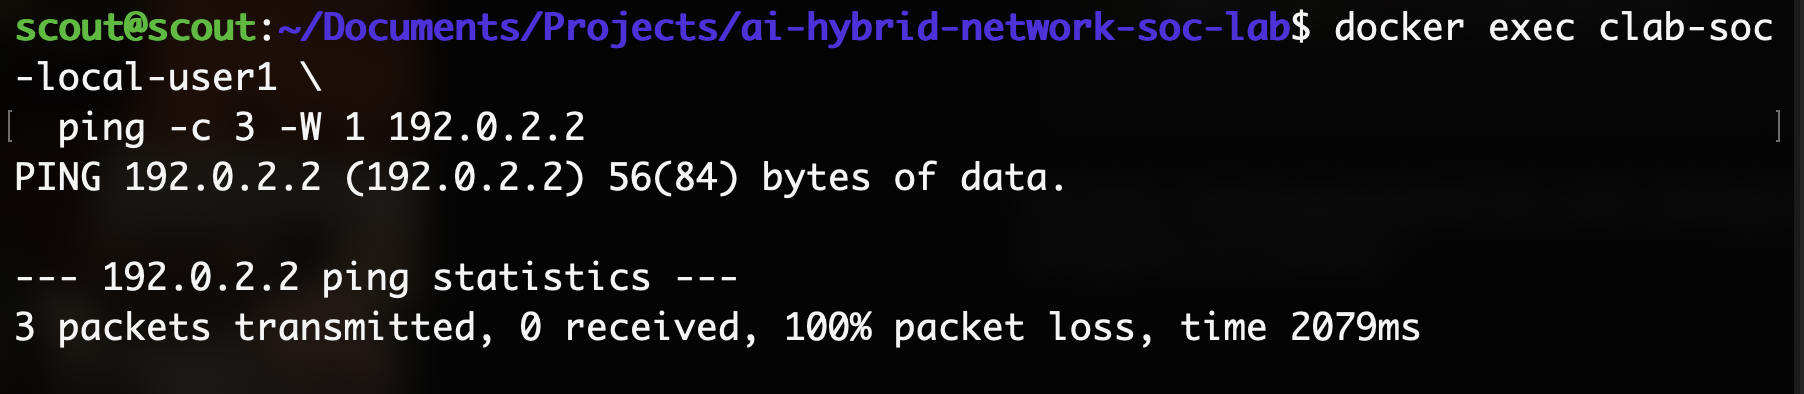
To make sure the VLANs were actively isolating traffic, I gave the local user1 and guest1 an IP address each in the same IP range:
 docker exec clab-soc-local-user1 \
  ip address add 192.0.2.1/24 dev eth1

docker exec clab-soc-local-guest1 \
  ip address add 192.0.2.2/24 dev eth1
But when I tried pinging guest1 from user1, the ping obviously failed since user1 is in VLAN 10 and guest1 is in VLAN 20:
Adding core1 and inter-VLAN routing
Now we are going to make the new topology with the core1 router, add the tagged trunk, and then configure VLAN gateway interfaces so inter-VLAN routing will work. The ping that failed from user1 to guest1 should hopefully work if everything is configured properly…
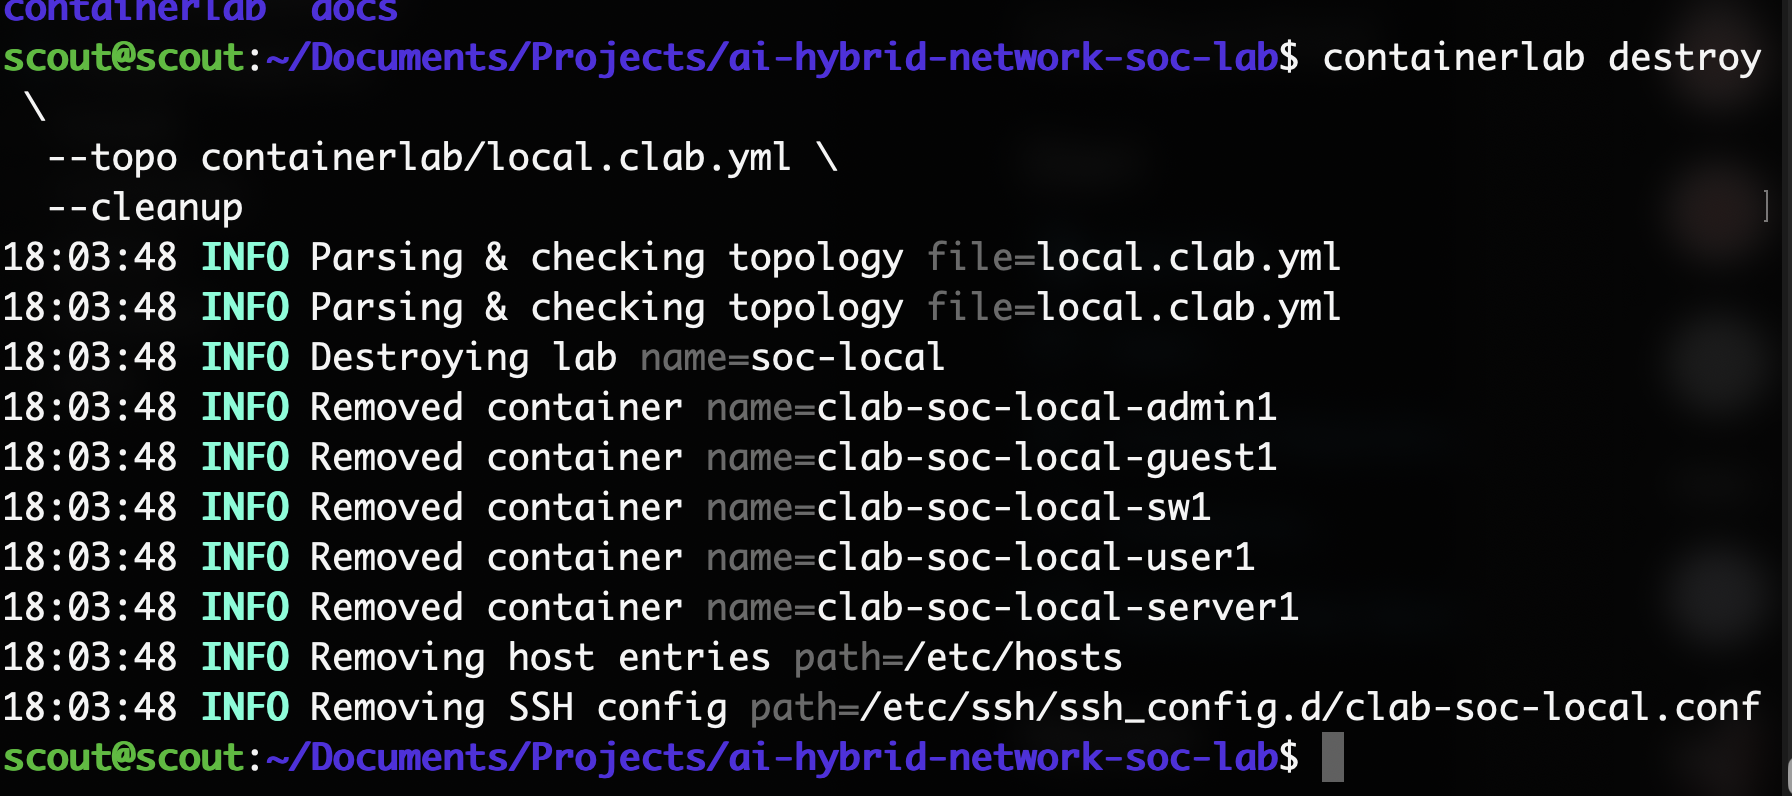
Destroying the old topology
And in the new topology, we use the FRR 10.7.0 image published through quay.io/frrouting/frr.
So now, when I look through the switch’s config, we can see that eth5, which is the trunk link, is tagged:
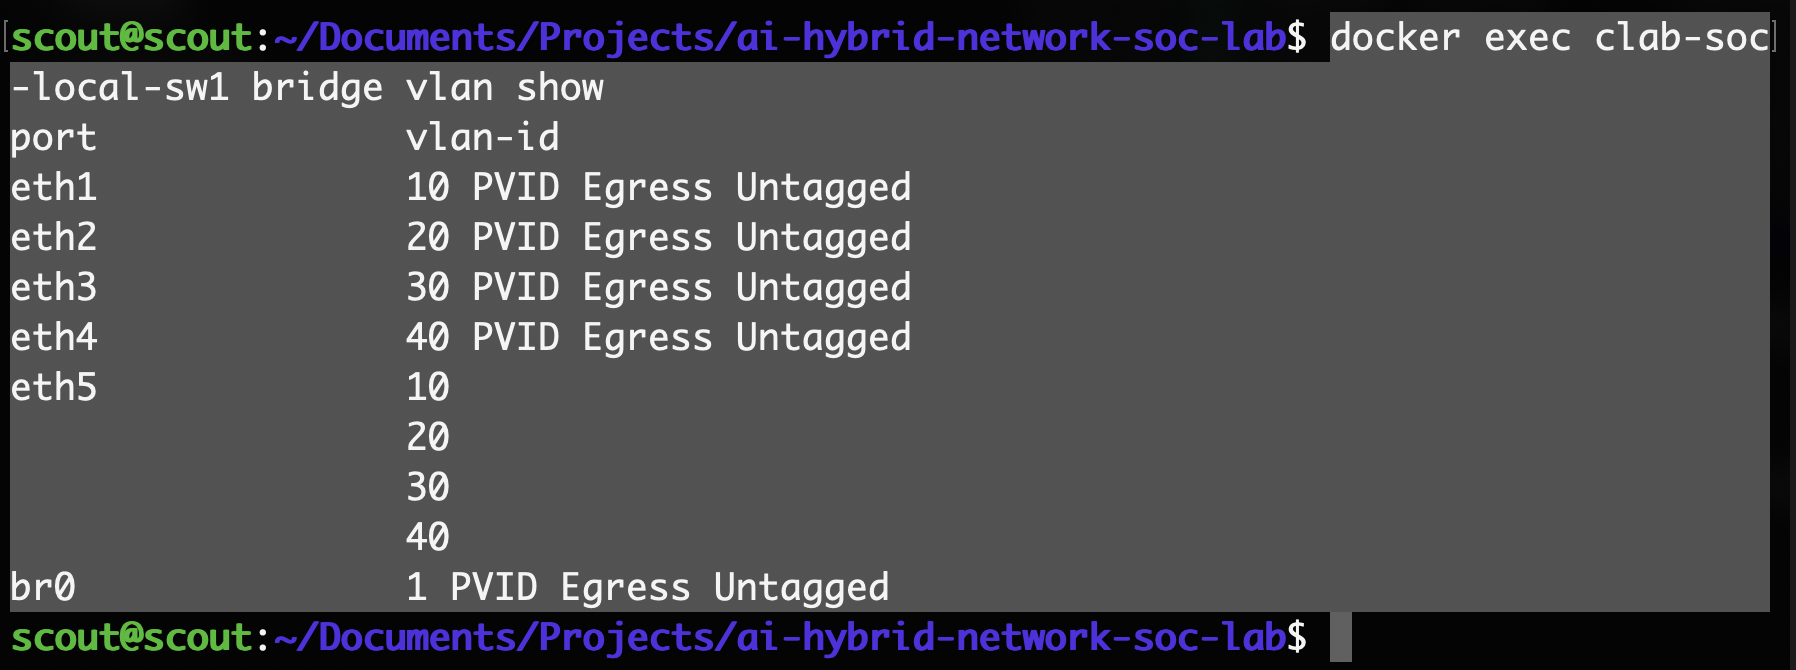
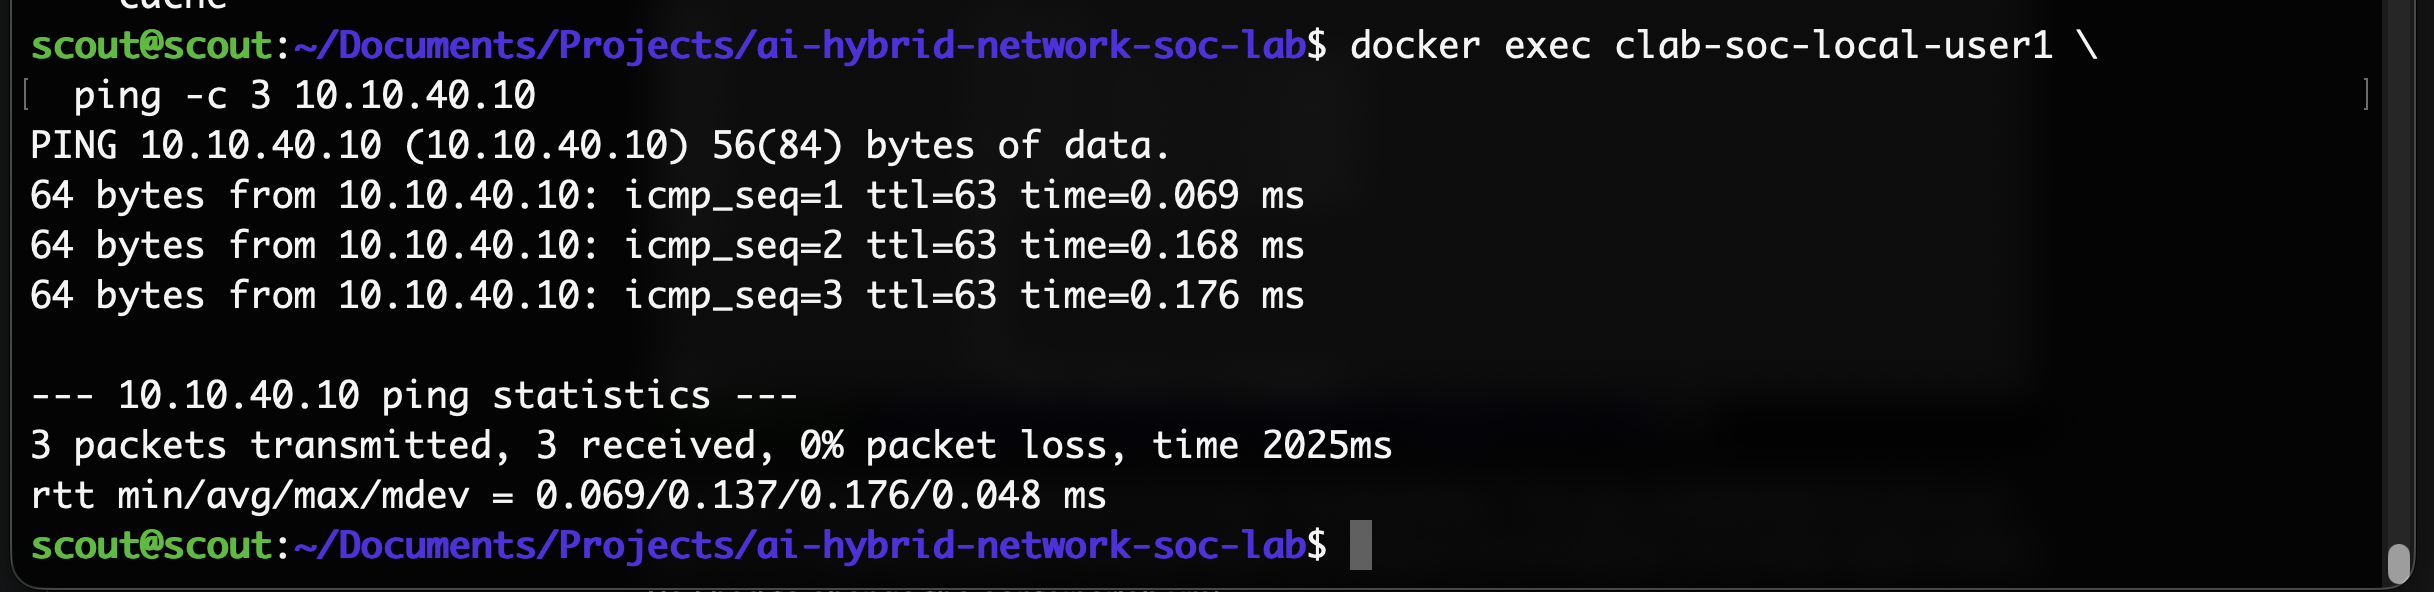
But when I tried pinging between the hosts, the ping failed. This was unexpected, but it turns out that my ip route add default command does not replace the old default; it simply adds another. So I had to change the Containerlab YAML.
But after making this change, inter-VLAN routing was working!! And the trunk was tagged.
Adding edge-fw1 and OSPF
Now I had to add Milestone 4, which is configuring the core1 router with an OSPF adjacency with edge-fw1.
So we also need to create a daemon file (https://github.com/FRRouting/frr/blob/master/tools/etc/frr/daemons) that we will use to enable OSPF. This will be used for both core1 and the edge router. I used the docs on GitHub and modified the existing documentation to just enable OSPF. We don’t really need any other routing protocol for this lab.
bgpd=no
ospfd=yes
ospf6d=no
ripd=no
ripngd=no
isisd=no
pimd=no
pim6d=no
ldpd=no
nhrpd=no
eigrpd=no
babeld=no
sharpd=no
pbrd=no
bfdd=no
fabricd=no
vrrpd=no
pathd=no

vtysh_enable=yes

zebra_options=" -A 127.0.0.1 -s 90000000"
mgmtd_options=" -A 127.0.0.1"
bgpd_options=" -A 127.0.0.1"
ospfd_options=" -A 127.0.0.1"
ospf6d_options=" -A ::1"
ripd_options=" -A 127.0.0.1"
ripngd_options=" -A ::1"
isisd_options=" -A 127.0.0.1"
pimd_options=" -A 127.0.0.1"
pim6d_options=" -A ::1"
ldpd_options=" -A 127.0.0.1"
nhrpd_options=" -A 127.0.0.1"
eigrpd_options=" -A 127.0.0.1"
babeld_options=" -A 127.0.0.1"
sharpd_options=" -A 127.0.0.1"
pbrd_options=" -A 127.0.0.1"
staticd_options=" -A 127.0.0.1"
bfdd_options=" -A 127.0.0.1"
fabricd_options=" -A 127.0.0.1"
vrrpd_options=" -A 127.0.0.1"
pathd_options=" -A 127.0.0.1"
Finally, we need to configure the core router. The configuration will be simple: all we need to do is configure a point-to-point OSPF adjacency with the edge router and enable OSPF. This ended up being the final configuration:
Note that we use the passive-interface command to make everything passive except for the connection on eth2, i.e., the edge router. It is generally a waste of bandwidth to advertise OSPF hello packets on access interfaces, and it can be a security risk: https://i.blackhat.com/BH-USA-25/Presentations/USA-25-Tung-From-Spoofing-To-Tunneling-New.pdf
frr version 10.7
frr defaults traditional
hostname core1
log stdout informational
service integrated-vtysh-config
!
interface eth2
 ip ospf network point-to-point
!
router ospf
 ospf router-id 10.255.255.1
 passive-interface default
 no passive-interface eth2
 network 10.10.10.0/24 area 0.0.0.0
 network 10.10.20.0/24 area 0.0.0.0
 network 10.10.30.0/24 area 0.0.0.0
 network 10.10.40.0/24 area 0.0.0.0
 network 10.255.0.0/30 area 0.0.0.0
 network 10.255.255.1/32 area 0.0.0.0
 log-adjacency-changes
!
line vty
!
The next config file I had to make was for the edge router. It was very similar to the core router’s, but with fewer networks to advertise:
frr version 10.7
frr defaults traditional
hostname edge-fw1
log stdout informational
service integrated-vtysh-config
!
interface eth1
 ip ospf network point-to-point
!
router ospf
 ospf router-id 10.255.255.2
 passive-interface default
 no passive-interface eth1
 network 10.255.0.0/30 area 0.0.0.0
 network 10.255.255.2/32 area 0.0.0.0
 log-adjacency-changes
!
line vty
!
I also needed to update the topology. I added the binds and the links between the edge router and core router. Importantly, I had to add the edge router.
After this configuration, everything worked, and now we had our edge router active:
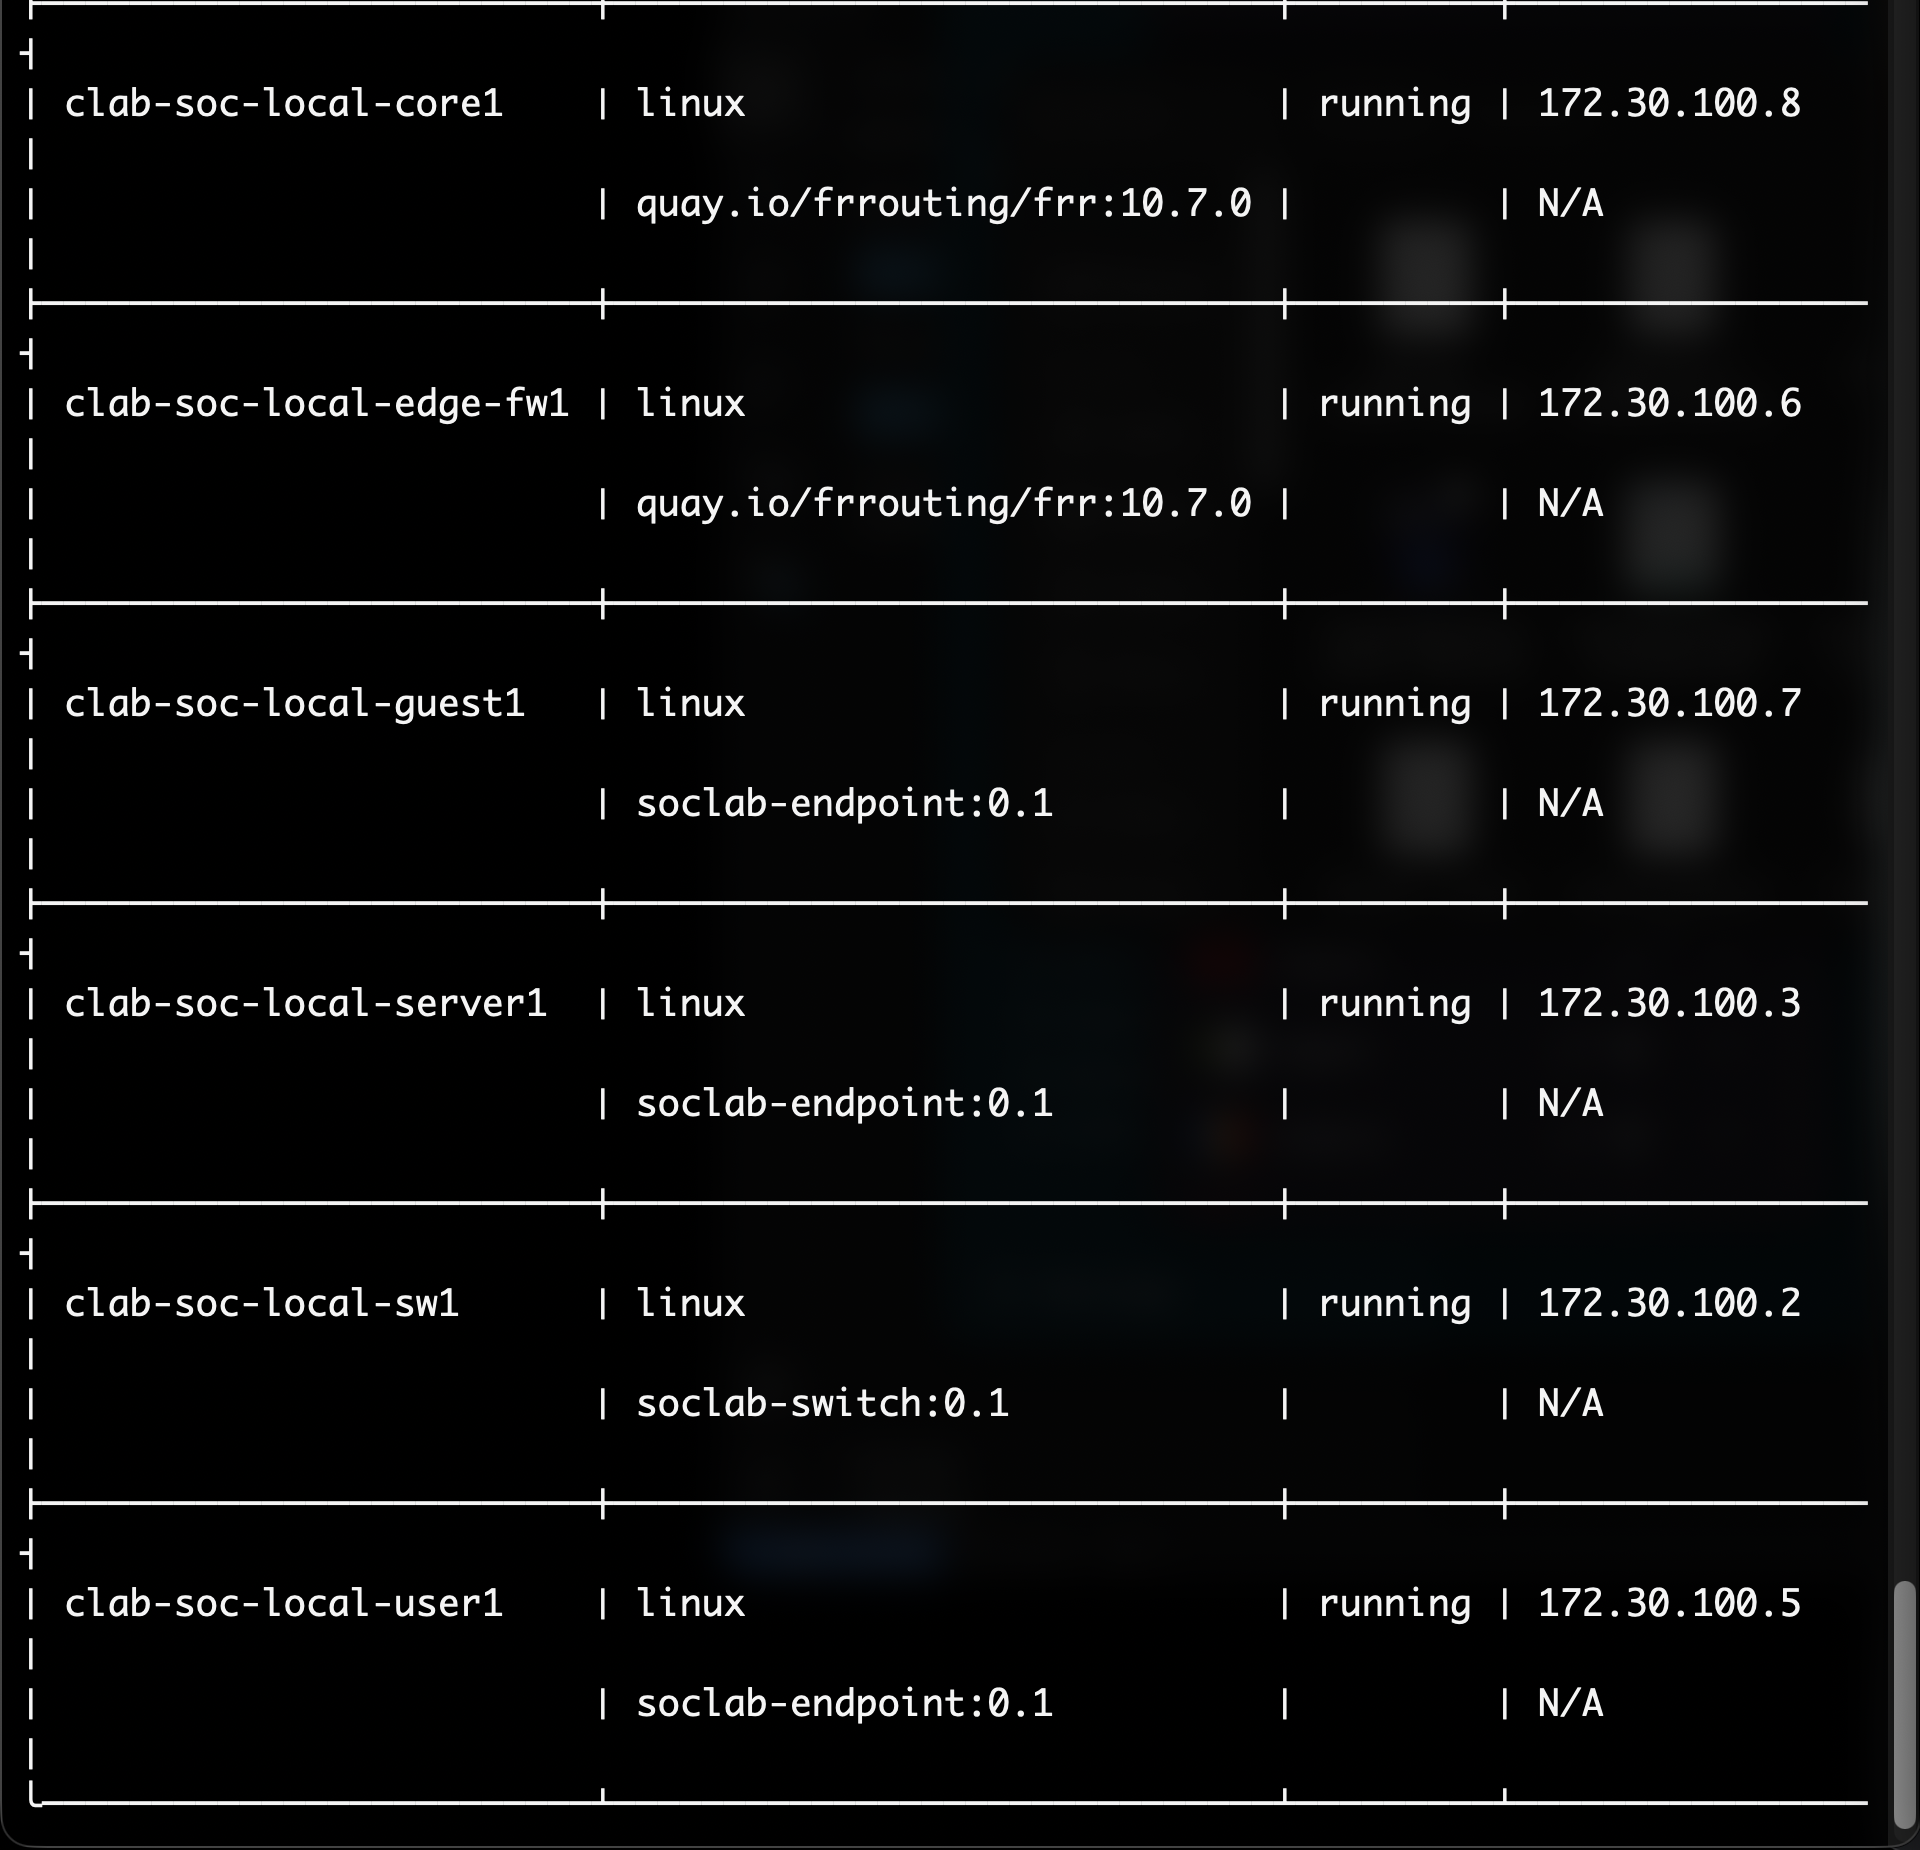
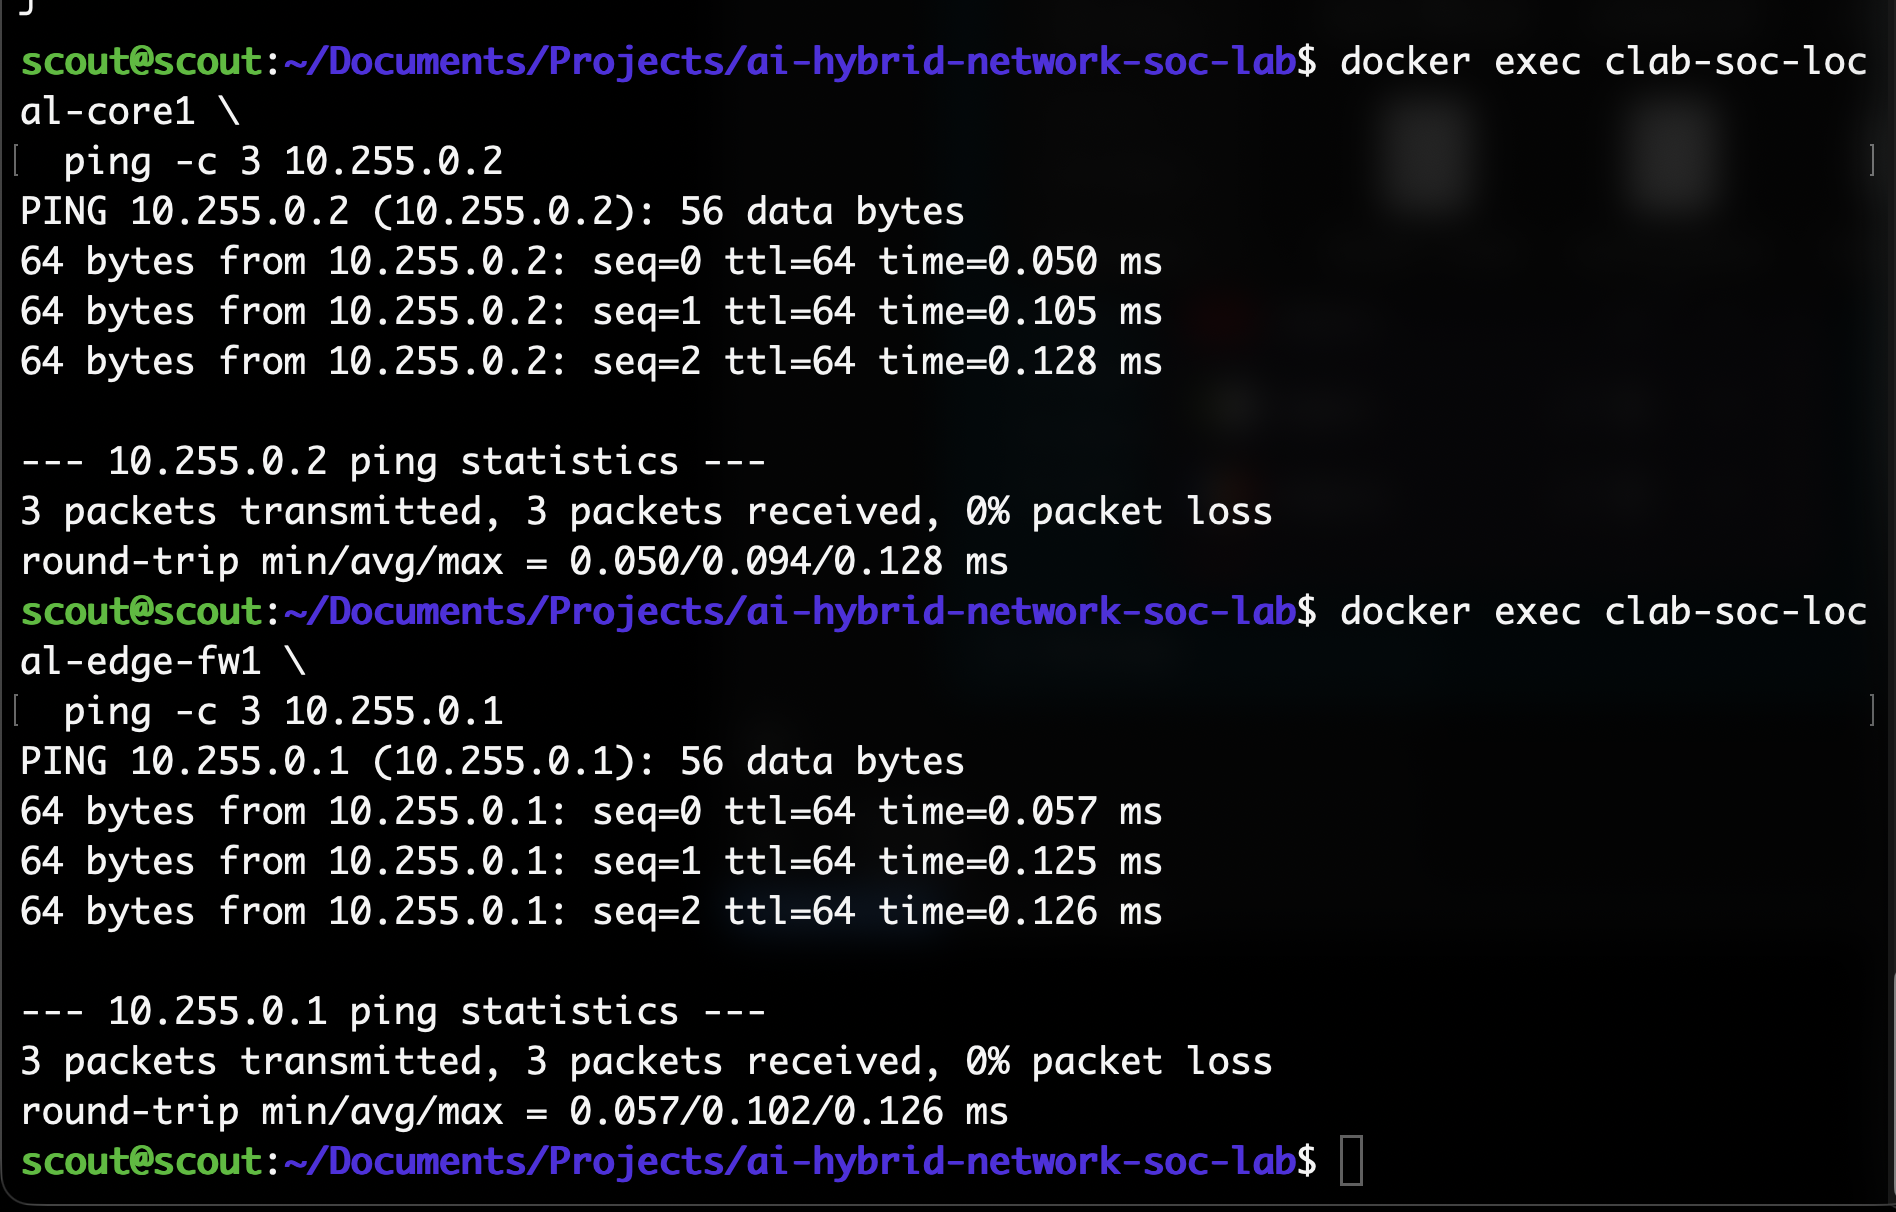
Traffic works both to and from the edge router:
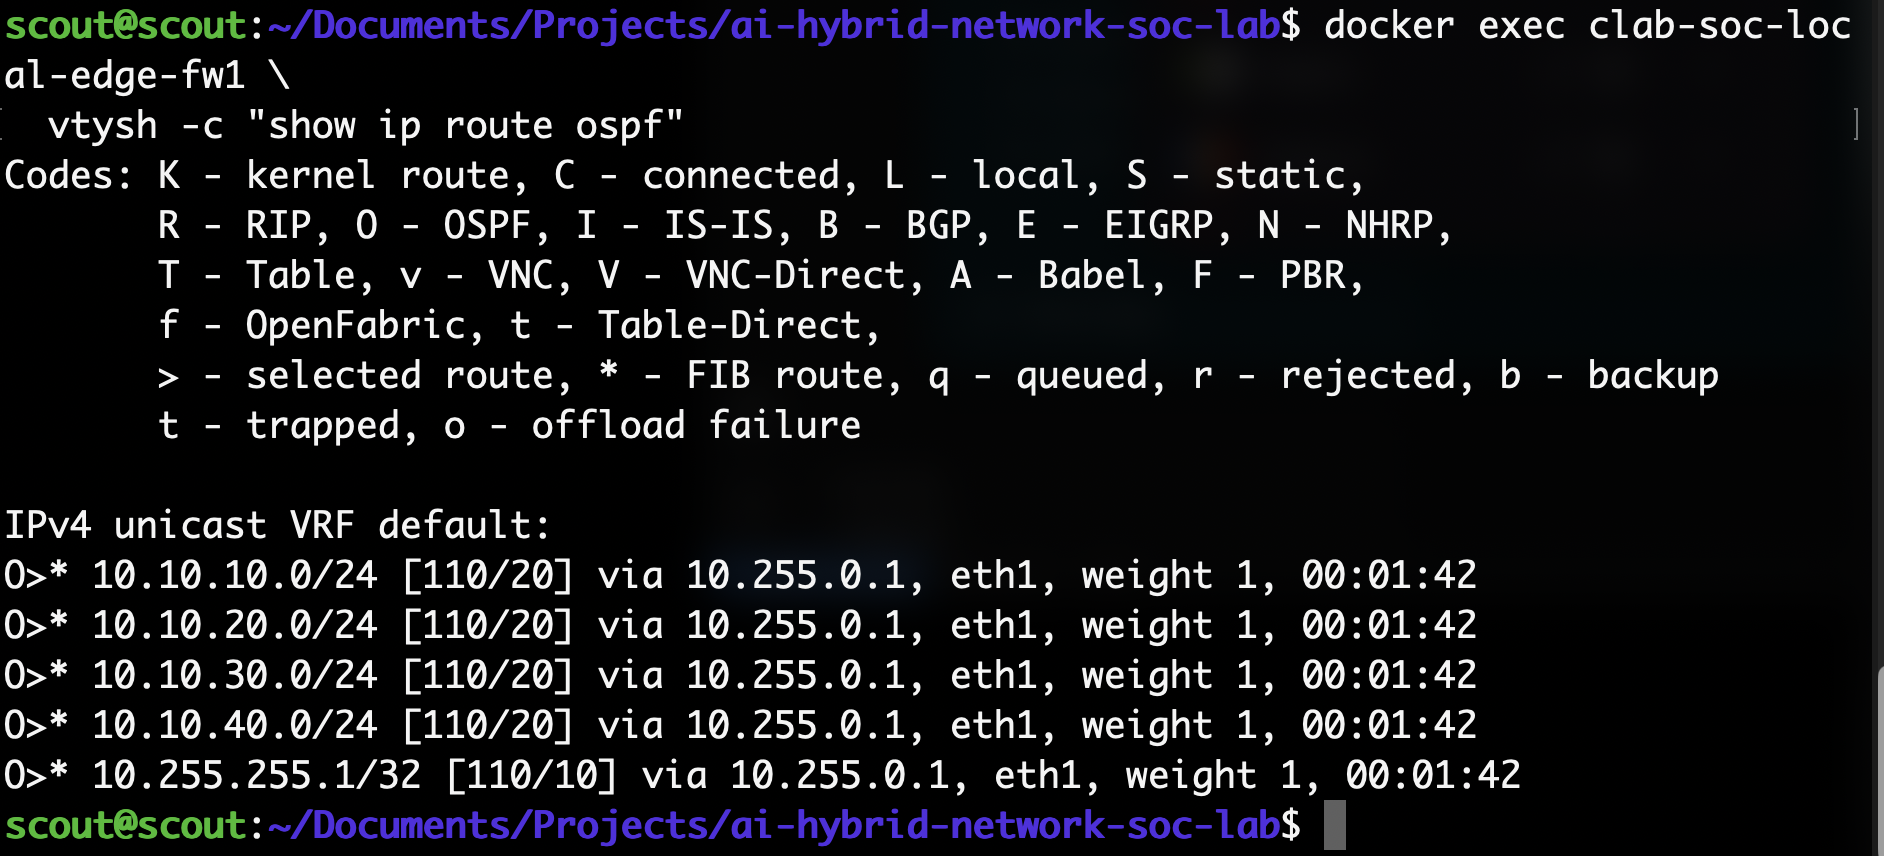
And our edge router successfully learned routes:
Firewall policy: inter-VLAN segmentation
Now the local network is fully set up. The only thing left to do is add a firewall.
As outlined in the security policy, we allow the users to access the server using HTTP but block ICMP pings. Additionally, outgoing requests to the server will be allowed, but incoming requests will not be. After all, why does the server need to send incoming requests to users?
People in the User VLAN shouldn’t be allowed to access resources in the Management VLAN either.
Finally, people in the Guest VLAN should not be able to access the User VLAN, the Management VLAN, or the Server VLAN.
A brief overview of what we will do:
| Test | Expected |
|---|---|
| User → server HTTP | Allowed |
| User → server ICMP | Blocked |
| User → Management VLAN | Blocked |
| Guest → internal networks | Blocked |
| Admin → server ICMP | Allowed |
| Server → User new connection | Blocked |
Now, in order to add all these rules, we need to filter the packets. We can do this with nftables.
Currently, everything is forwarded, and we are not blocking anything. Now, if this were a Cisco router, we could just add ACLs and be done with this, but unfortunately, FRR only gives us routing protocols, not a firewall.
So I created a Dockerfile for the router and added nftables:
FROM quay.io/frrouting/frr:10.7.0

USER root

RUN apk add --no-cache \
    nftables \
    tcpdump
And in order to test this, we also need a server. This was my lightweight server’s Dockerfile:
FROM alpine:3.22

RUN apk add --no-cache \
    curl \
    darkhttpd \
    iproute2 \
    iputils \
    tcpdump

CMD ["sleep", "infinity"]
And this was the page that would be displayed:
<!doctype html>
<html lang="en">
<head>
  <meta charset="utf-8">
  <title>SOC Lab Server</title>
</head>
<body>
  <h1>Scout's approved SOC LAB SERVER</h1>
  <p>You must be a user if you're seeing this. If not pls leave</p>
</body>
</html>
After updating the binds, we had our firewall up and running.
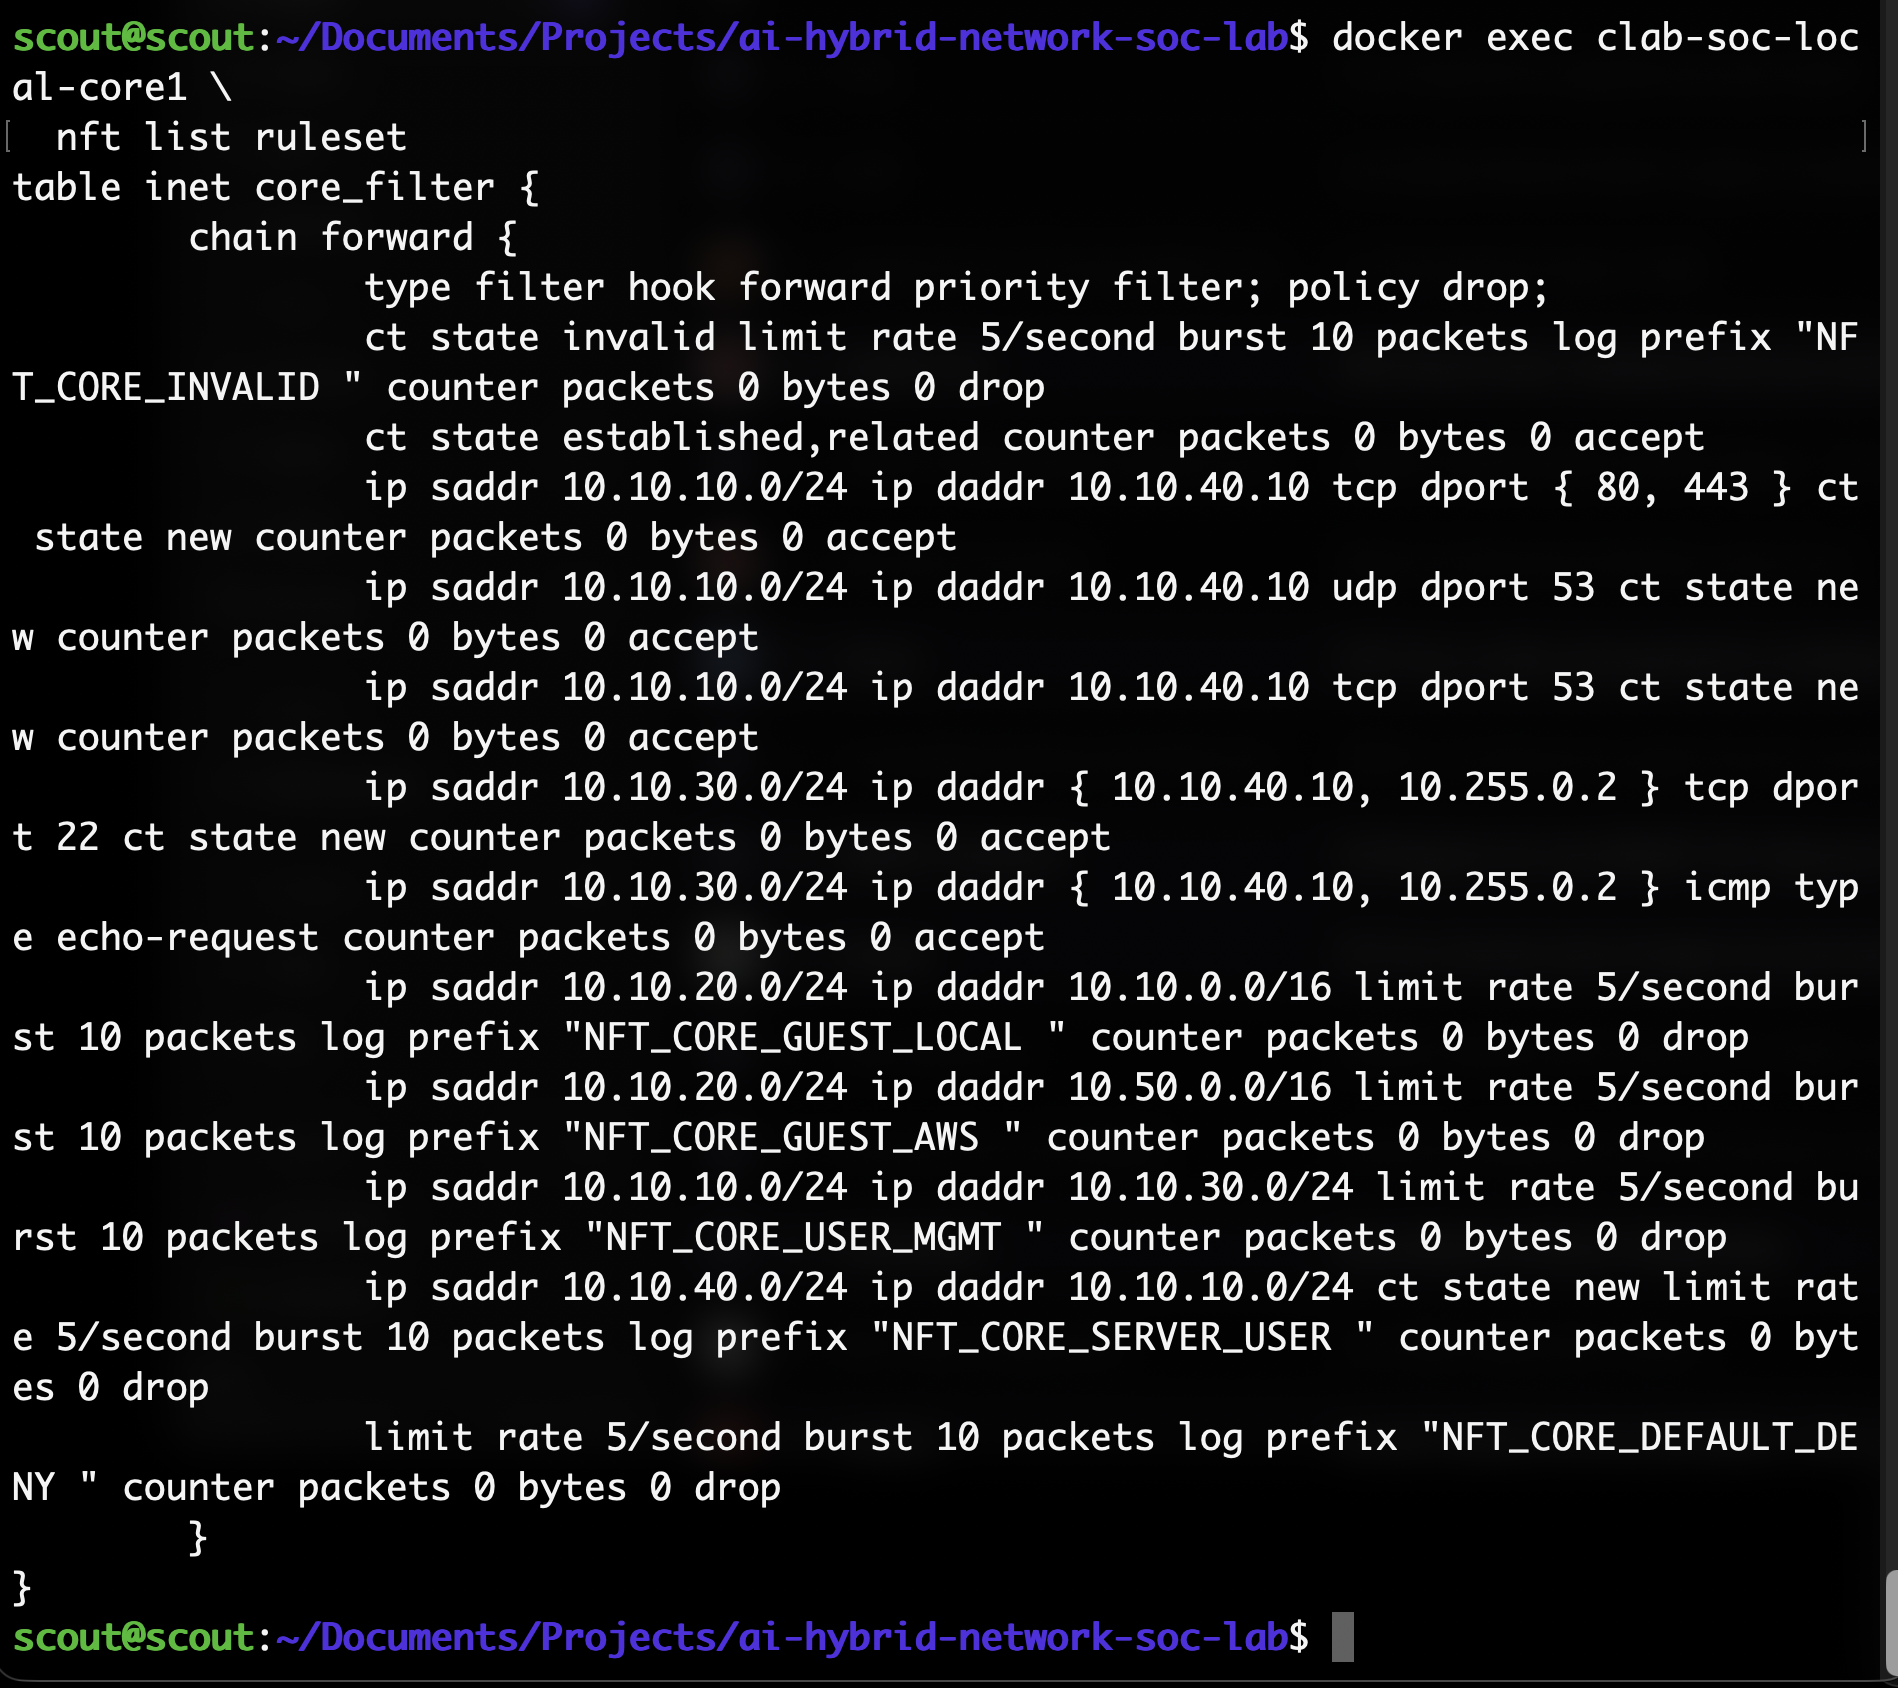
And the user was able to ping the server:
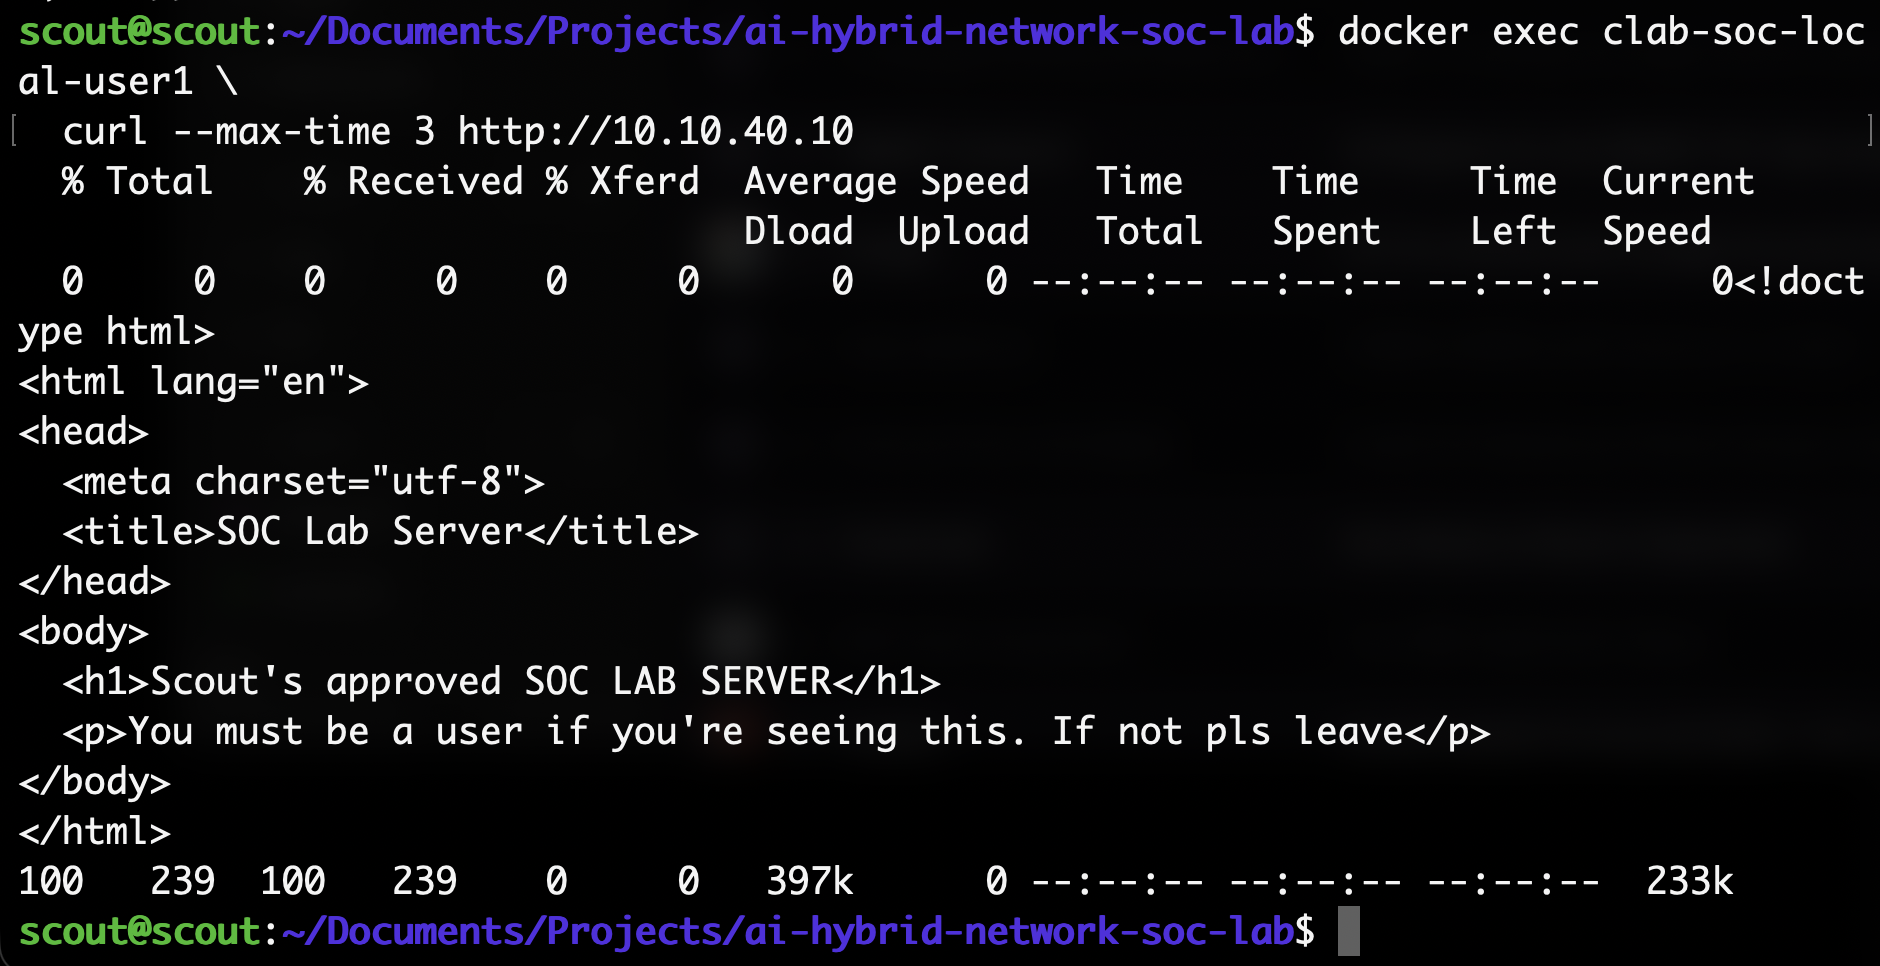
ICMP pings to the server from the user failed, as expected:
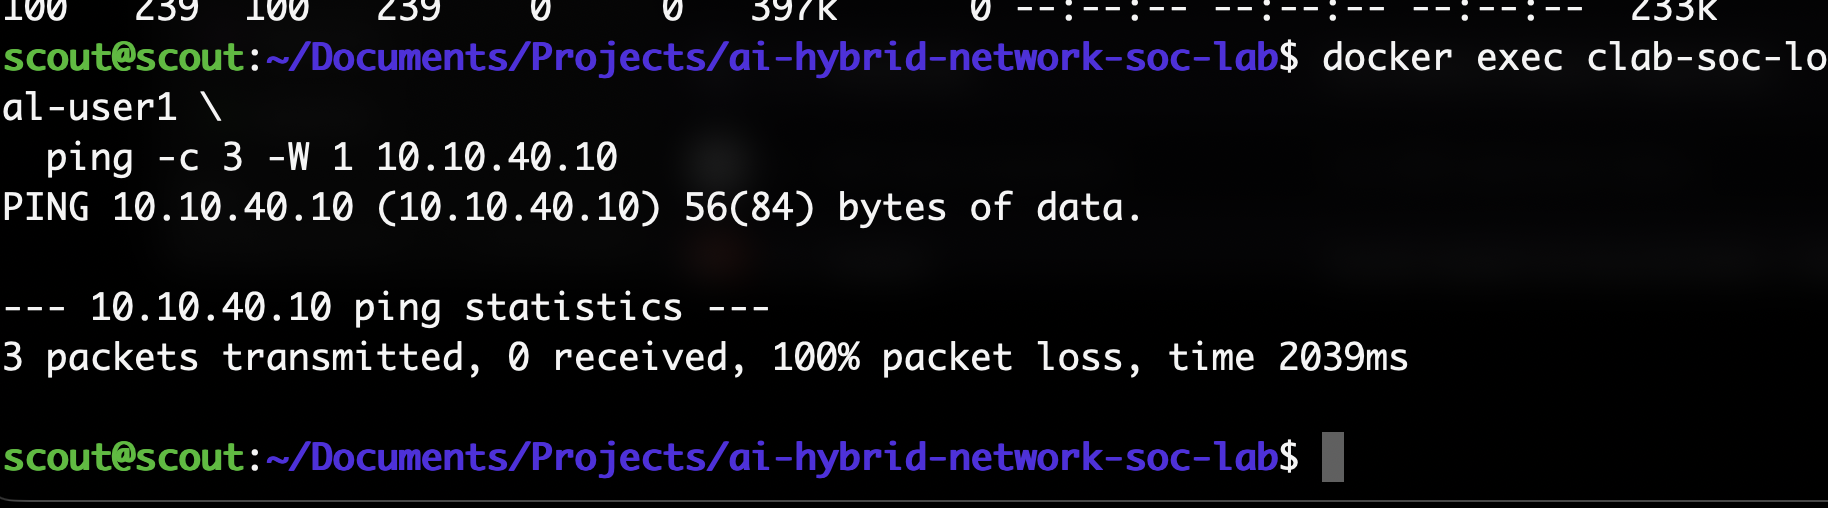
And pings from the user to the Management VLAN also failed.
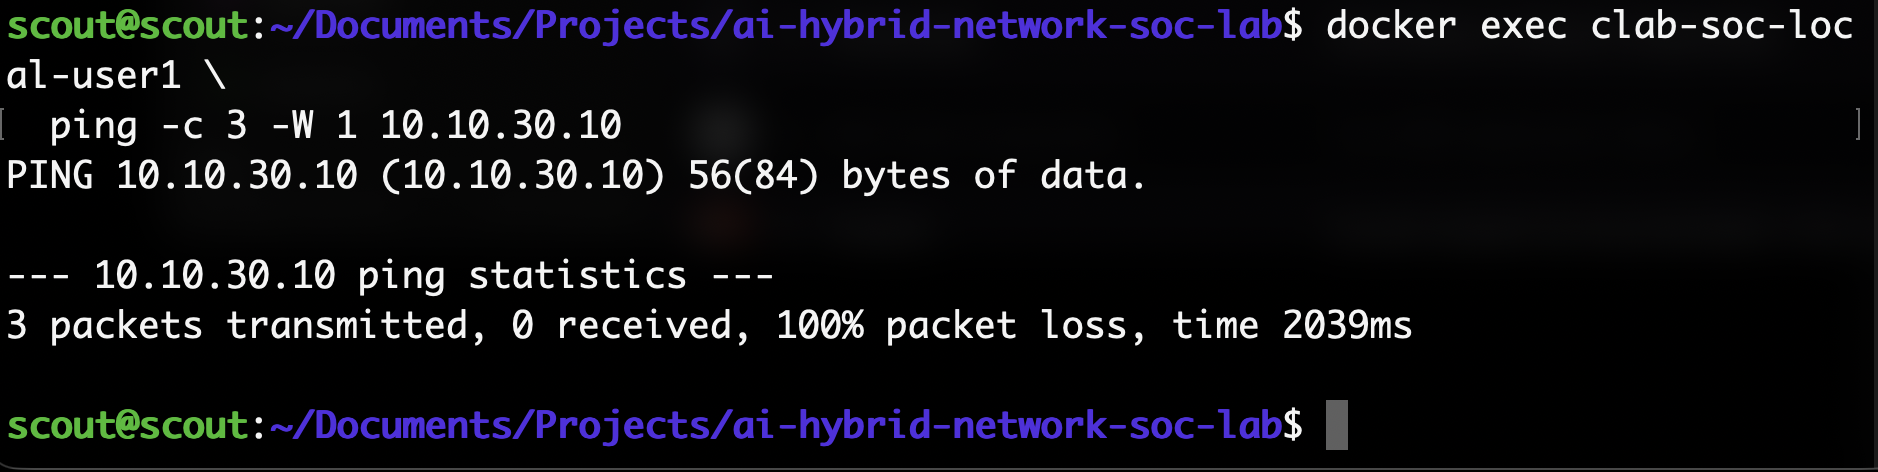
Firewall policy: protecting the routers
Now we have to handle traffic addressed directly to the core router. We want to allow OSPF from the edge, SSH administration from admin, and pings sent directly from our Linux laptop. That is what I do here:
chain input {
     type filter hook input priority 0;
     policy drop;

     # I-IN-002: Drop malformed or untrackable traffic.
     ct state invalid \
         limit rate 5/second burst 10 packets \
         log prefix "NFT_CORE_INPUT_INVALID " \
         counter drop

     # I-IN-001: Allow replies to connections initiated by core1.
     ct state established,related counter accept

     # Local processes must be able to communicate over loopback.
     iifname "lo" counter accept

     # Permit management from the Containerlab host only.
     # 172.30.100.1 is the Docker bridge gateway, not every container.
     iifname "eth0" \
         ip saddr 172.30.100.1 \
         counter accept

     # I-IN-020: Accept OSPF only from edge-fw1 on the transit link.
     iifname "eth2" \
         ip saddr 10.255.0.2 \
         ip protocol ospf \
         counter accept

     # I-IN-010: Permit future SSH administration from admin1.
     ip saddr 10.10.30.10 \
         tcp dport 22 \
         ct state new \
         counter accept

     # I-IN-011: Permit diagnostic ping from admin1.
     ip saddr 10.10.30.10 \
         icmp type echo-request \
         counter accept

     # I-IN-099: Deny everything else addressed to core1.
     limit rate 5/second burst 10 packets \
         log prefix "NFT_CORE_INPUT_DENY " \
         counter drop
 }
And I did the same thing for the edge router. I added the firewall to the topology and then rebuilt the topology:
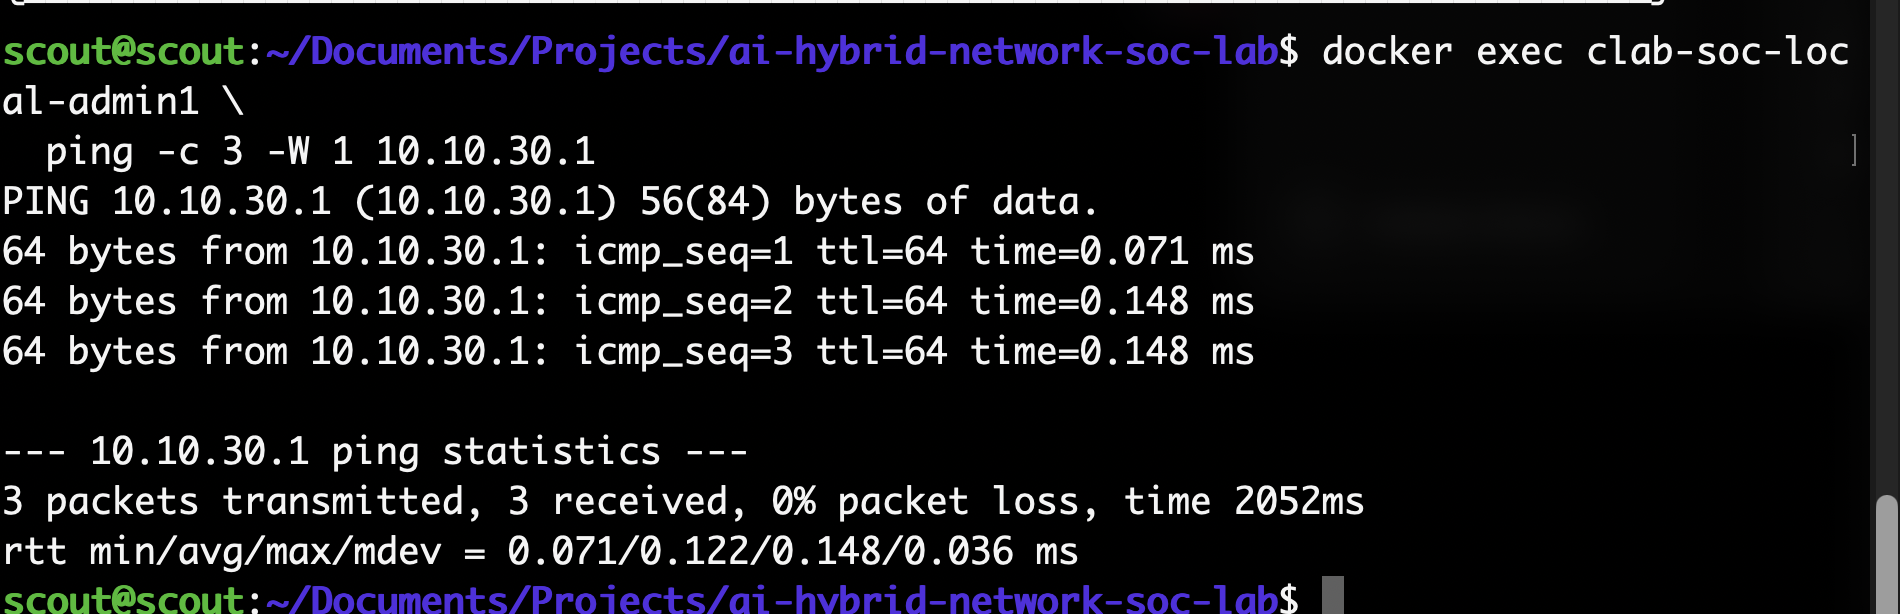
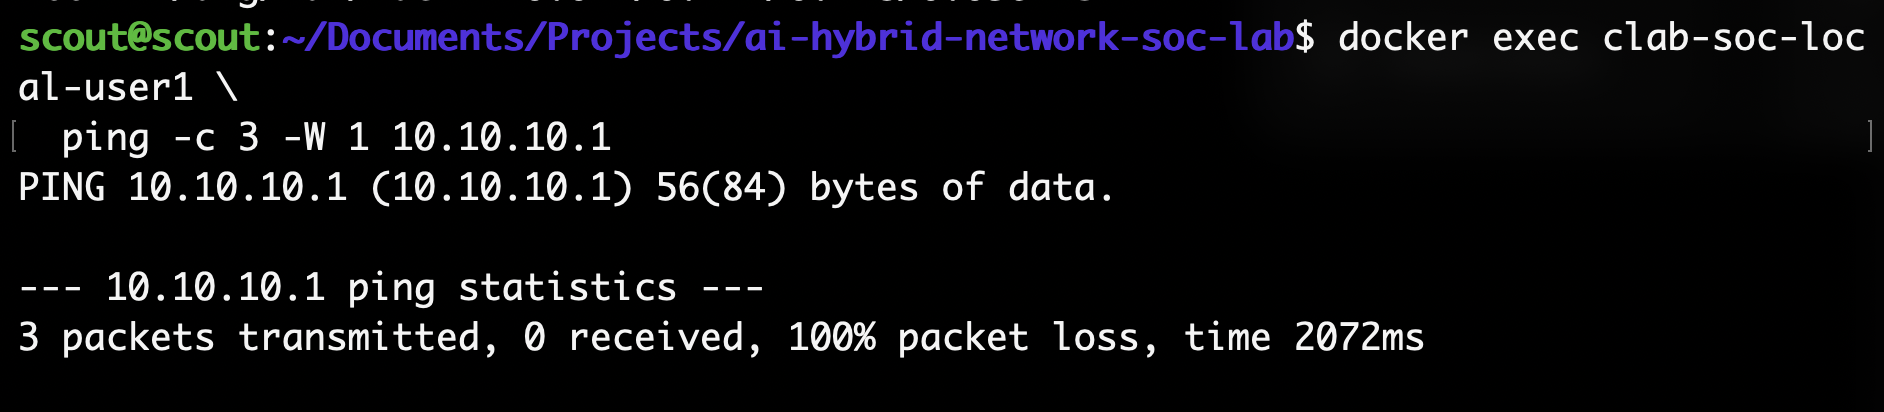
Now admin-to-core passes, which it did before, but user-to-core is failing, which, importantly, it did not do before:
And when testing our firewall for the edge router, ICMP pings do not go through from the core router, but OSPF messages are allowed:

Passive monitoring with Zeek and Suricata
Now everything in the network is fully set up, so it’s time to do traffic mirroring, aka a wiretap on the network.
This will not be an inline wiretap. Instead, we will forward a copy of all the traffic to our passive sensor, where we will use Zeek and Suricata to analyze the traffic.
We use both Zeek and Suricata to give us two observation points, and also because I want practice using both.
Building the sensor image
Firstly, we install the official Zeek image, Suricata, and some troubleshooting tools. Importantly, we also add our sensor startup script. The startup script is important here because we need to configure the interfaces, i.e., set promiscuous mode and remove IP addresses so the sensor can’t participate in conversations. And we need to start Zeek and Suricata:
#!/usr/bin/env bash
set -euo pipefail

wait_for_interface() {
    local interface="$1"

    for attempt in $(seq 1 60); do
        if ip link show "$interface" >/dev/null 2>&1; then
            return 0
        fi

        sleep 1
    done

    echo "ERROR: interface $interface did not appear"
    return 1
}

for interface in sniff0 sniff1; do
    wait_for_interface "$interface"

    ip link set dev "$interface" up
    ip link set dev "$interface" promisc on

    # The monitoring interfaces should not have Layer-3 addresses.
    ip address flush dev "$interface"
done

mkdir -p \
    /var/log/soc/zeek/internal \
    /var/log/soc/zeek/transit \
    /var/log/soc/suricata

# Zeek instance for the internal VLAN trunk.
(
    cd /var/log/soc/zeek/internal

    exec zeek \
        -C \
        -i sniff0 \
        /opt/soc/zeek/local.zeek
) &
ZEEK_INTERNAL_PID=$!

# Zeek instance for the core-to-edge transit link.
(
    cd /var/log/soc/zeek/transit

    exec zeek \
        -C \
        -i sniff1 \
        /opt/soc/zeek/local.zeek
) &
ZEEK_TRANSIT_PID=$!

# Suricata initially watches the internal mirror.
suricata \
    -c /etc/suricata/suricata.yaml \
    -i sniff0 \
    -l /var/log/soc/suricata \
    -S /opt/soc/suricata/local.rules &
SURICATA_PID=$!

cleanup() {
    kill \
        "$ZEEK_INTERNAL_PID" \
        "$ZEEK_TRANSIT_PID" \
        "$SURICATA_PID" \
        2>/dev/null || true

    wait 2>/dev/null || true
}

trap cleanup EXIT INT TERM

wait -n \
    "$ZEEK_INTERNAL_PID" \
    "$ZEEK_TRANSIT_PID" \
    "$SURICATA_PID"
Configuring Zeek logs
For Zeek, we also use JSON logs instead of tab-separated logs since this will make the Python analysis easier. We also tell Zeek which networks are in our environment:
@load policy/tuning/json-logs

redef Site::local_nets += {
    10.10.0.0/16,
    10.255.0.0/16,
    10.50.0.0/16
};
Adding the initial Suricata rules
For Suricata, we need to define some rules:
alert icmp 10.10.20.0/24 any -> 10.10.40.10 any (msg:"SOC LAB Guest ICMP attempt to server"; itype:8; sid:1000001; rev:1;)

alert http 10.10.10.0/24 any -> 10.10.40.10 80 (msg:"SOC LAB Approved user HTTP request"; flow:to_server,established; http.method; content:"GET"; sid:1000002; rev:1;)
This is just checking Guest ICMP attempts to the server and allowed HTTP requests from user1 to server1.
We will add more rules later. These are just to verify that Suricata is working.
Connecting the sensor and mirroring traffic
Now that the image and initial rules are done, we need to add this sensor to the actual lab.
Firstly, I had to add tc (traffic control) to the router since it allows us to mirror traffic and pass it to our sensor.
We will capture ingress and egress traffic on sw1 and the core router.
The core router’s ingress and egress traffic allows us to see what was dropped by the router.
Let’s set up the capture for sw1 first:
# Passive mirror destination toward sensor1.
     # eth6 is intentionally not added to br0.
     - ip link set eth6 up

     # Copy traffic entering and leaving the VLAN trunk.
     - tc qdisc add dev eth5 clsact
     - tc filter add dev eth5 ingress protocol all pref 10 matchall action mirred egress mirror dev eth6
     - tc filter add dev eth5 egress protocol all pref 10 matchall action mirred egress mirror dev eth6
We copy the traffic crossing eth5 and send it to eth6, toward our sensor1:sniff.
We also did the same thing for the router mirror and added a sensor node.
After adding these changes to the topology, I rebuilt the images for the sensor and router (remember, we added tc) using docker build. And those worked.
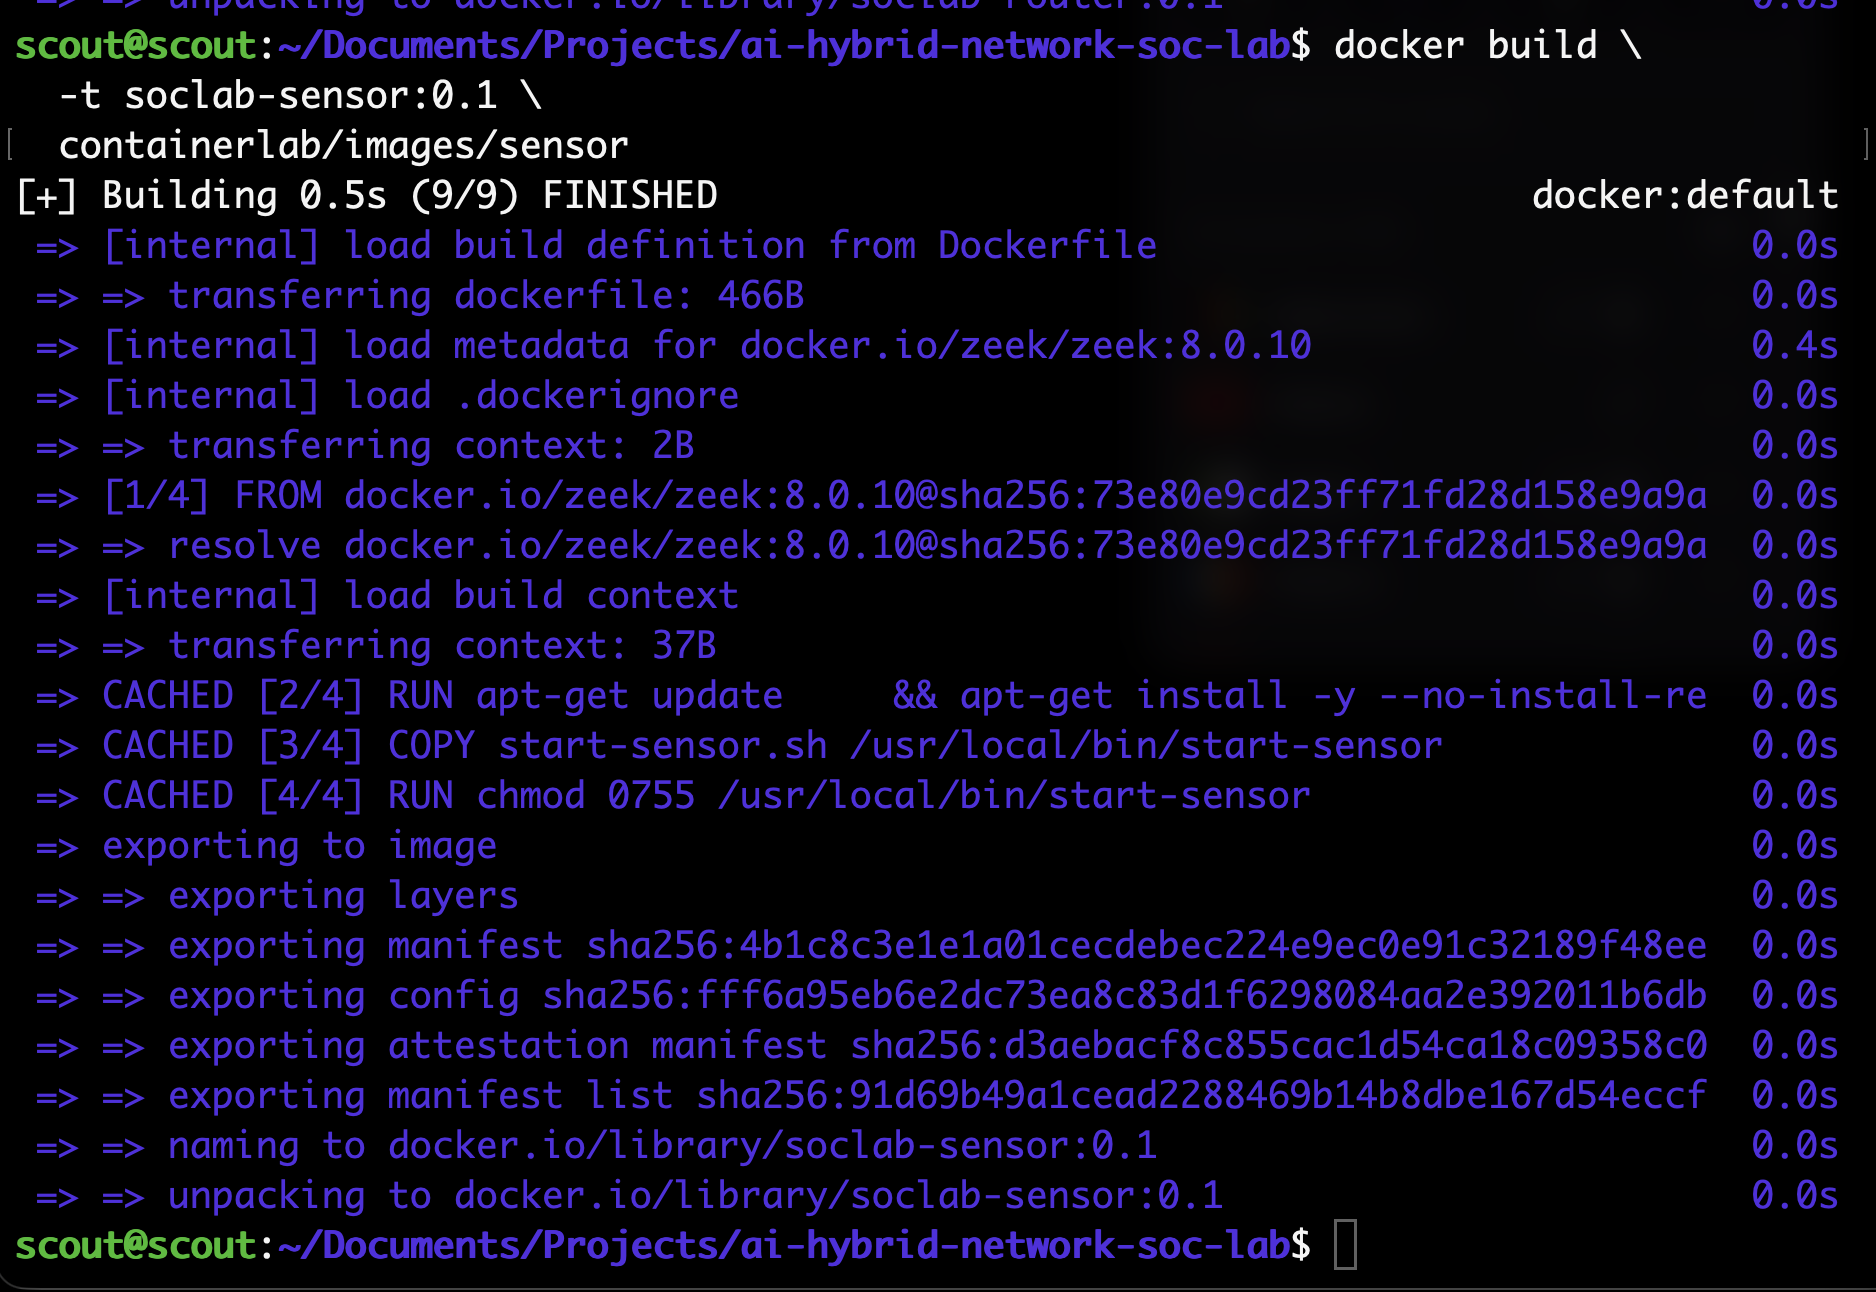
After deployment, we can see that the sensor is now running:
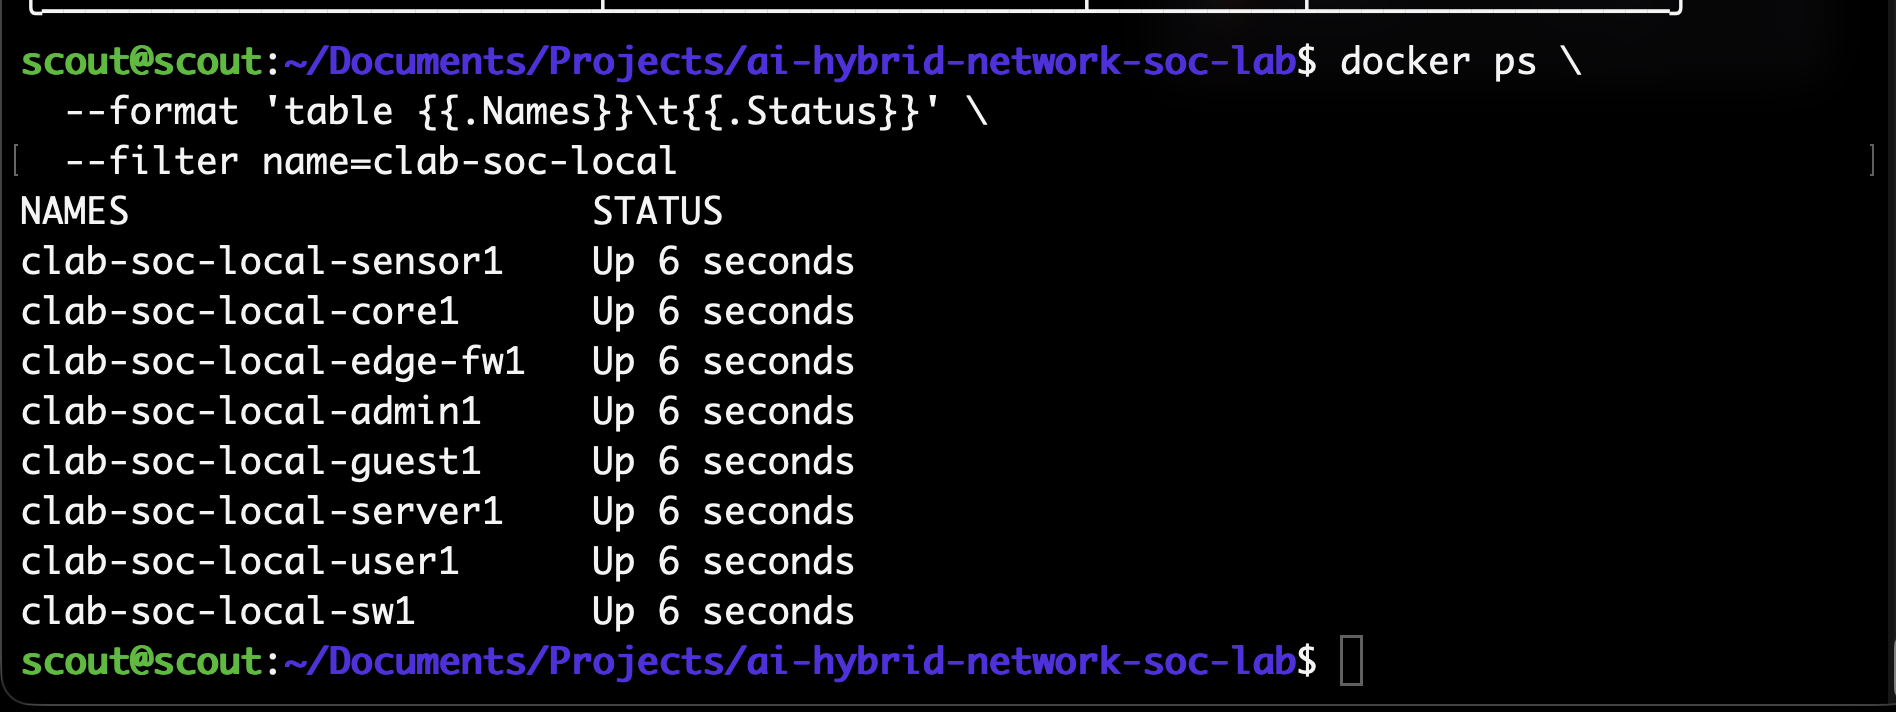
Checking capture interfaces and traffic
Now I’m checking the configurations. Firstly, I need to make sure the sniffers are in promiscuous mode:
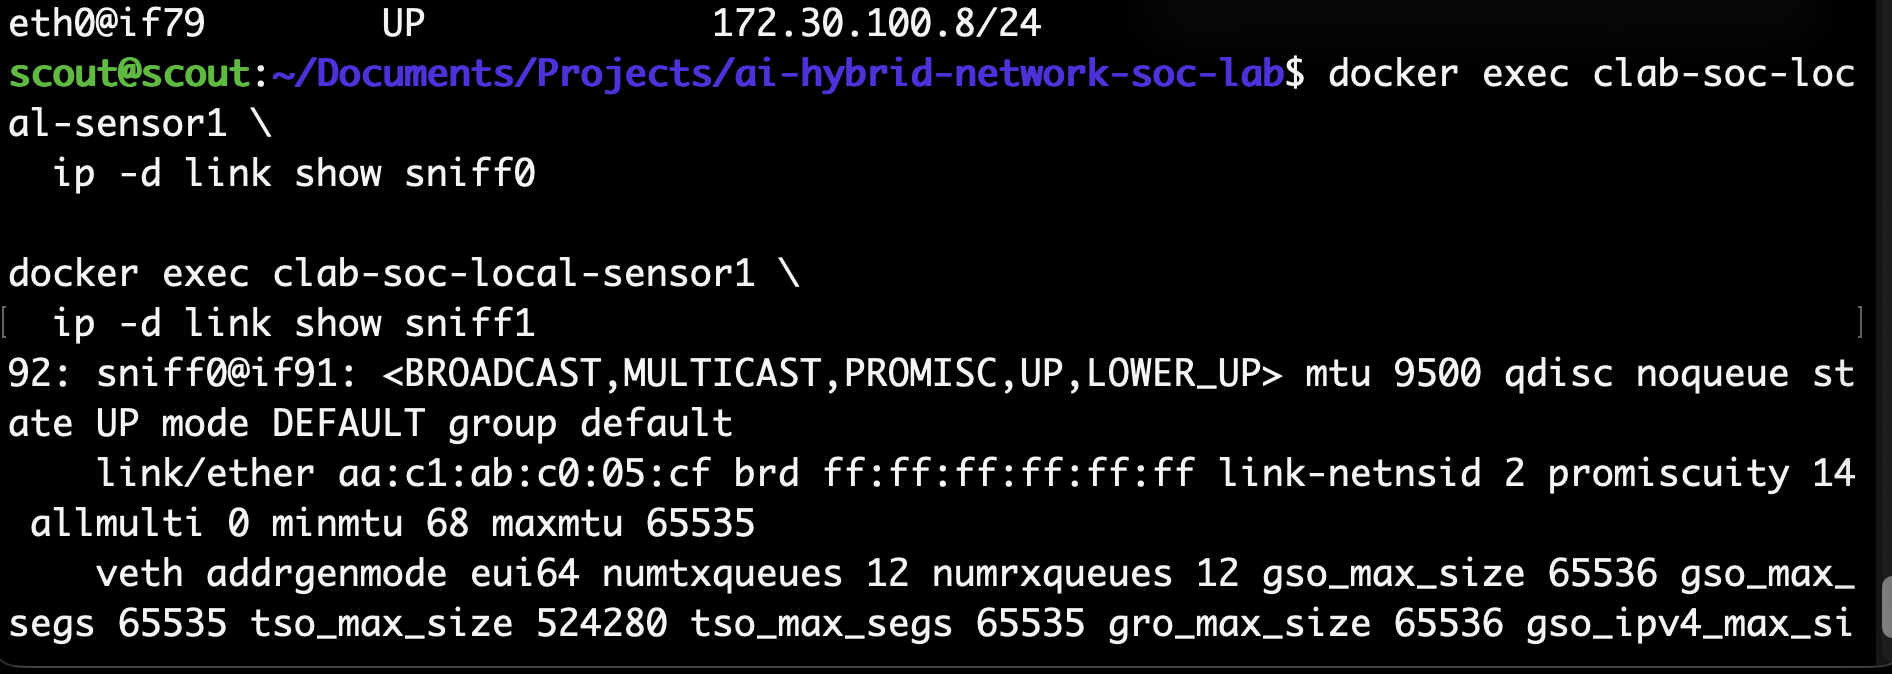
They were. IPv4 forwarding should also be disabled, which was the case on the sensor:

Then I ran a quick test to see if the traffic was being captured correctly:
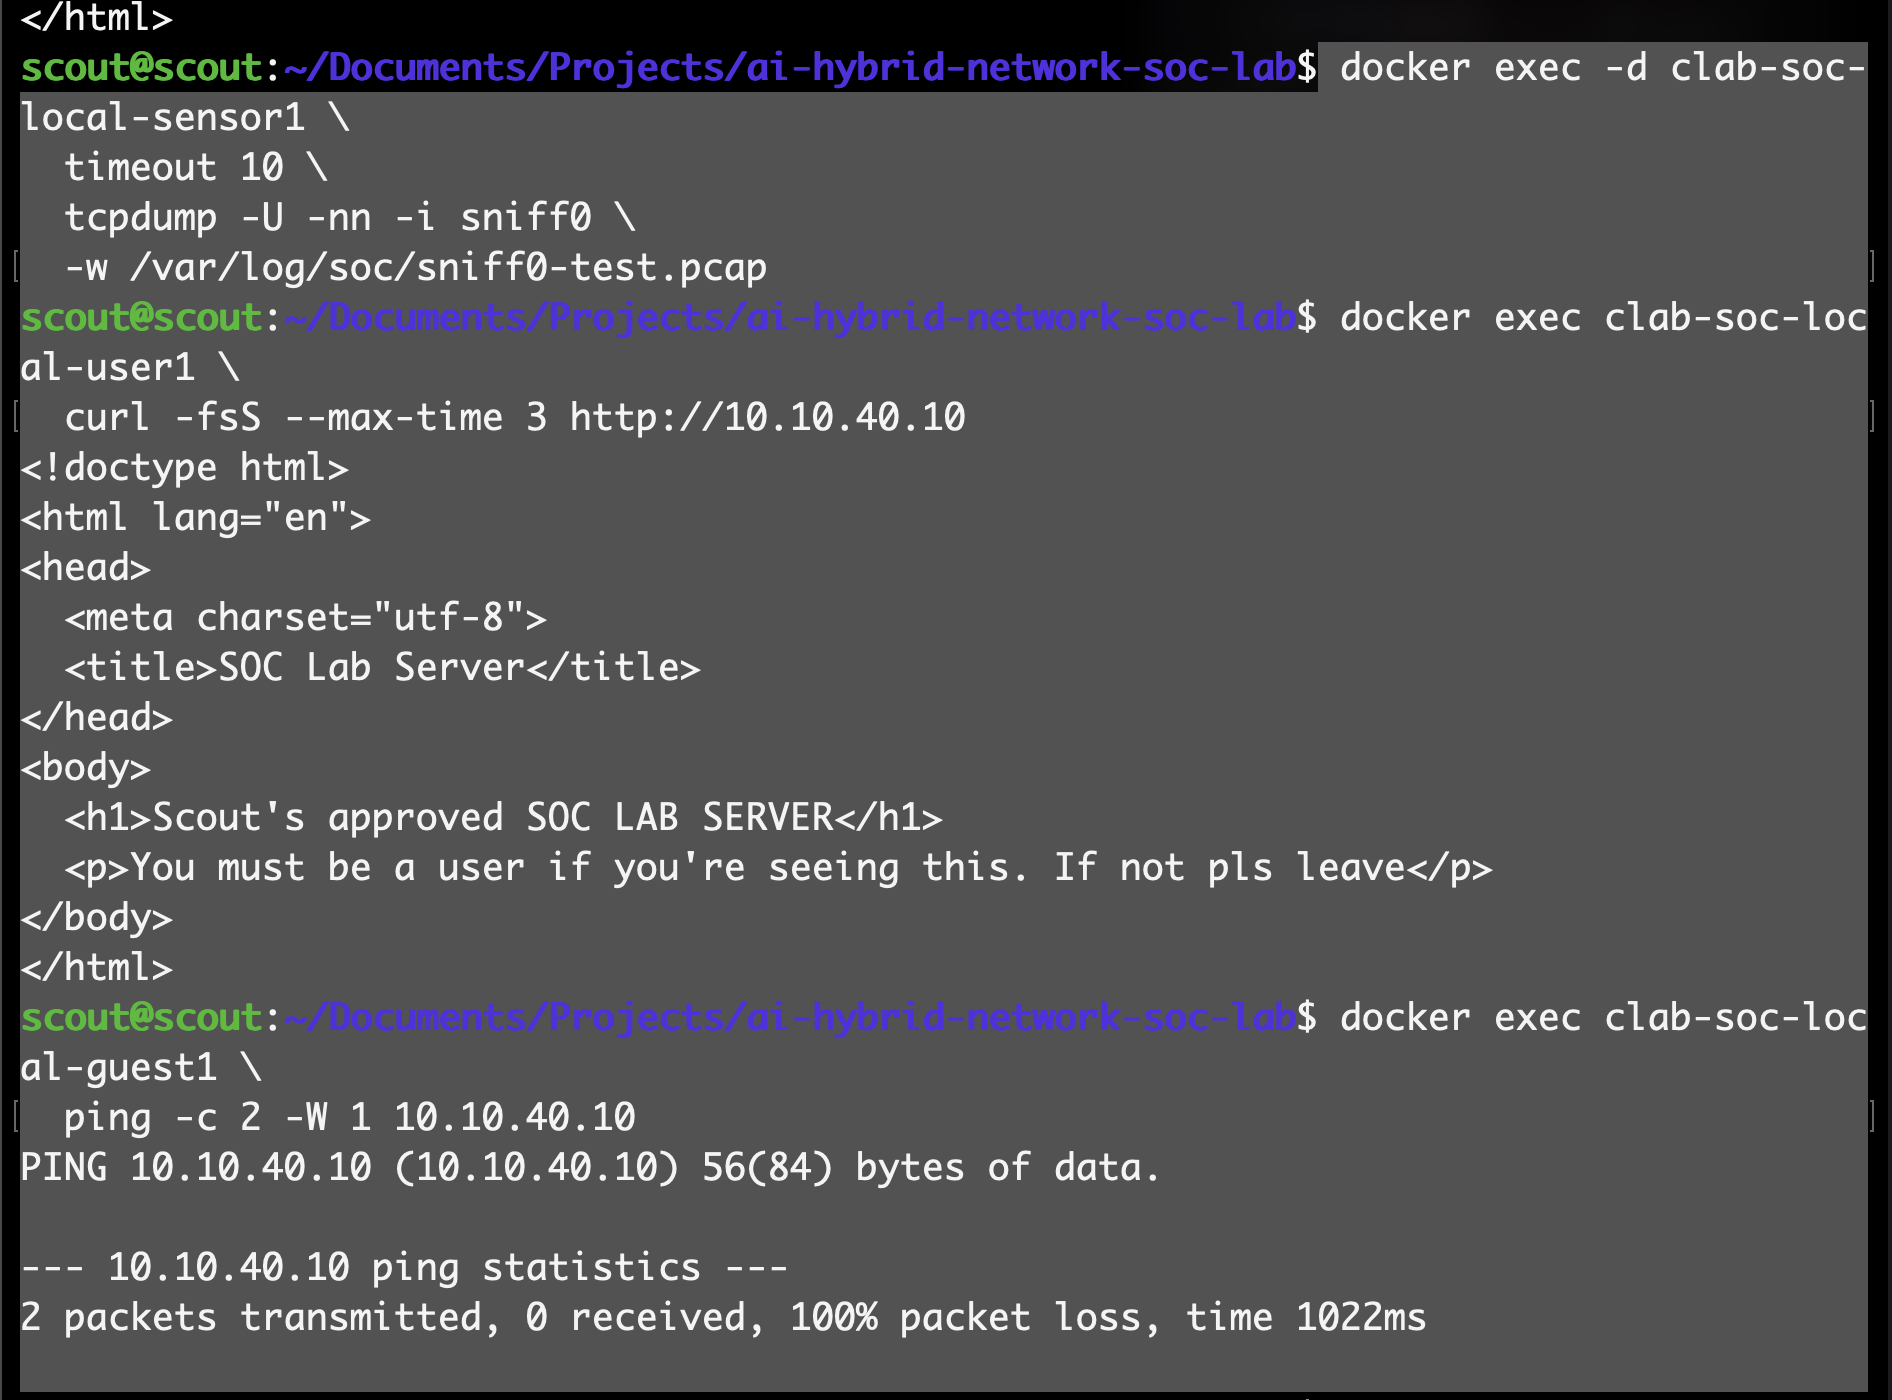
Troubleshooting duplicate packet captures
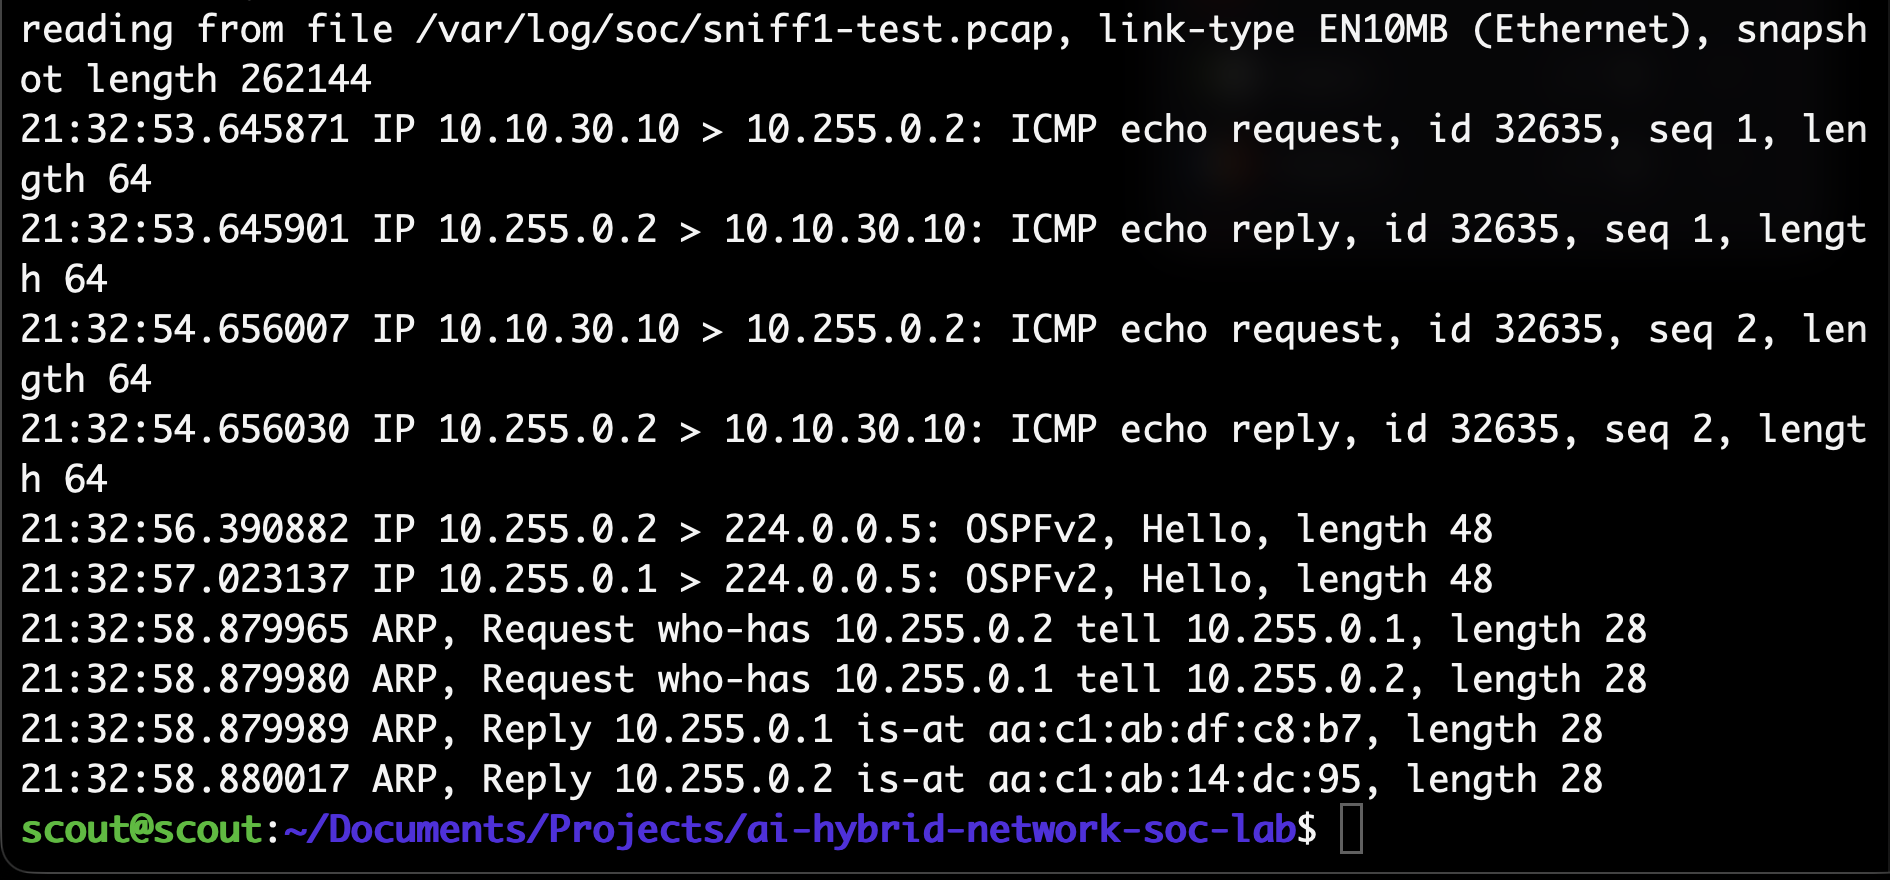
Everything worked except for the fact that our switch is not capable of VLAN switching. It’s a Layer 2 dumb switch. It requires the router to switch VLANs. Every time there is inter-VLAN traffic, the switch sees the same traffic twice: once on egress and once on ingress. So we need to remove the ingress mirror. We just capture traffic going toward the router.
I fixed this by removing this line from the Containerlab YAML:
- tc filter add dev eth5 ingress protocol all pref 10 matchall action mirred egress mirror dev eth6And this fixed the topology. sniff1 and sniff0 were capturing traffic without duplicating it:
Troubleshooting missing HTTP alerts
But when I checked the Suricata logs, the HTTP requests were missing. It turns out that since the source and destination were in separate VLANs, Suricata was treating requests and responses as two different conversations. So our rule for approved HTTP requests was not being triggered.
After doing some research, I had to add one line to Suricata’s startup command.
I had to add this:
--set vlan.use-for-tracking=false All this does is tell Suricata to track the conversation by IP addresses, ports, and protocol without treating the changed VLAN as a different connection.
And when I checked Suricata’s logs again, I found the request:
{"timestamp":"2026-08-27T22:22:06.672193+0000","source":"10.10.10.10","destination":"10.10.40.10","signature":"SOC LAB Approved user HTTP request","sid":1000002}So both Zeek and Suricata are now working.
Automating tests and clean redeployment
Now I wanted to write a Bash script so I wouldn’t have to run these tests manually and could make sure everything was working well. Ideally, the script would check that:
- Containers are online.
- OSPF is working.
- Zeek and Suricata are running.
- Our approved traffic paths succeed.
- Our prohibited paths fail.
- Sensor interfaces do not have IPv4 addresses.
- The wiretap works.
- Zeek and Suricata correctly capture records.
The validation script is on GitHub: tests/validate-local.sh.
Redeploying the lab
After writing this Bash script, I created another script that is responsible for deploying the lab:
#!/usr/bin/env bash

set -Eeuo pipefail

SCRIPT_DIR="$(cd -- "$(dirname -- "${BASH_SOURCE[0]}")" && pwd)"
REPO_ROOT="$(cd -- "$SCRIPT_DIR/.." && pwd)"

TOPOLOGY="$REPO_ROOT/containerlab/local.clab.yml"
VALIDATION_SCRIPT="$REPO_ROOT/tests/validate-local.sh"
LOG_DIR="$REPO_ROOT/monitoring/logs"
ARCHIVE_ROOT="$REPO_ROOT/monitoring/data/redeploy-archives"
ARCHIVE_PATH=""

handle_error() {
  local status=$?
  trap - ERR
  printf '\nRedeployment failed while running: %s\n' "$BASH_COMMAND" >&2
  printf 'The lab has been left in its current state for troubleshooting.\n' >&2
  exit "$status"
}

trap handle_error ERR

require_file() {
  local path="$1"

  if [[ ! -f "$path" ]]; then
    printf 'Required file is missing: %s\n' "$path" >&2
    exit 1
  fi
}

require_command() {
  local command_name="$1"

  if ! command -v "$command_name" >/dev/null 2>&1; then
    printf 'Required command is unavailable: %s\n' "$command_name" >&2
    exit 1
  fi
}

build_image() {
  local image_tag="$1"
  local build_context="$2"

  printf '\nBuilding %s...\n' "$image_tag"
  docker build --tag "$image_tag" "$build_context"
}

printf 'SOC lab clean redeployment\n'
printf 'Project: %s\n' "$REPO_ROOT"

require_command docker
require_command containerlab
require_file "$TOPOLOGY"
require_file "$VALIDATION_SCRIPT"
require_file "$REPO_ROOT/containerlab/images/switch/Dockerfile"
require_file "$REPO_ROOT/containerlab/images/endpoint/Dockerfile"
require_file "$REPO_ROOT/containerlab/images/router/Dockerfile"
require_file "$REPO_ROOT/containerlab/images/sensor/Dockerfile"
require_file "$REPO_ROOT/monitoring/zeek/local.zeek"
require_file "$REPO_ROOT/monitoring/suricata/local.rules"

if [[ ! -x "$VALIDATION_SCRIPT" ]]; then
  printf 'Validation script is not executable: %s\n' "$VALIDATION_SCRIPT" >&2
  exit 1
fi

printf '\nChecking access to Docker...\n'
docker info >/dev/null

if docker ps -a --format '{{.Names}}' | grep -q '^clab-soc-local-'; then
  printf '\nDestroying the existing soc-local lab...\n'
  containerlab destroy --topo "$TOPOLOGY" --cleanup
else
  printf '\nNo existing soc-local containers were found; skipping destroy.\n'
fi

if [[ -d "$LOG_DIR" ]] && [[ -n "$(find "$LOG_DIR" -mindepth 1 -print -quit 2>/dev/null)" ]]; then
  archive_stamp="$(date -u +%Y%m%dT%H%M%SZ)"
  ARCHIVE_PATH="$ARCHIVE_ROOT/${archive_stamp}-$$"
  mkdir -p "$ARCHIVE_PATH"
  mv "$LOG_DIR" "$ARCHIVE_PATH/logs"
  printf '\nArchived previous sensor logs at:\n%s\n' "$ARCHIVE_PATH/logs"
fi

mkdir -p \
  "$LOG_DIR/zeek/internal" \
  "$LOG_DIR/zeek/transit" \
  "$LOG_DIR/suricata"

build_image soclab-switch:0.1 "$REPO_ROOT/containerlab/images/switch"
build_image soclab-endpoint:0.1 "$REPO_ROOT/containerlab/images/endpoint"
build_image soclab-router:0.1 "$REPO_ROOT/containerlab/images/router"
build_image soclab-sensor:0.1 "$REPO_ROOT/containerlab/images/sensor"

printf '\nDeploying a fresh soc-local lab...\n'
containerlab deploy --topo "$TOPOLOGY"

printf '\nWaiting 15 seconds for the lab infrastructure to settle...\n'
sleep 15

printf '\nRunning the complete local acceptance test suite...\n'
"$VALIDATION_SCRIPT"

printf '\nClean redeployment completed successfully.\n'
printf 'The validated lab has been left running.\n'

if [[ -n "$ARCHIVE_PATH" ]]; then
  printf 'Previous logs are preserved at: %s/logs\n' "$ARCHIVE_PATH"
fi
This makes sure that Docker and Containerlab are present and that we are in the correct directory.
Then we destroy the lab, archive the logs, rebuild the custom images, and deploy a fresh topology. We then run the 44-check script and leave the lab running.
The problem was that when I first did this, the admin1 → edge ping was failing. I suspected this was a timing issue since all the other tests were passing. I changed the time we spend waiting from 10 seconds to 15 seconds, and everything seemed to work.
Now it’s time to work on the AWS portion.
Connecting the lab to AWS
Deploying the AWS instances
After creating the networking foundation, I added two small Amazon Linux 2023 EC2 instances:
- A
t3.microWireGuard gateway at10.50.10.10 - A
t3.microprivate application server at10.50.20.10
Both instances use encrypted 8 GiB gp3 root volumes. I chose small instances, one Availability Zone, and no NAT Gateway to keep the lab inexpensive. The private application does not have a public IPv4 address.
The WireGuard gateway has an Elastic IP because my local edge-fw1 container needs a stable Internet address to contact. I did not expose public SSH. Public inbound access is limited to WireGuard UDP port 51820 from my current public IP address.
My real public IP is stored in terraform.tfvars, which is excluded from Git. The repository only contains terraform.tfvars.example with a documentation address. If I change networks or enable a VPN, my public IP can change, so I need to update this variable and apply Terraform again.
Understanding the route tables
The public VPN subnet has this route:
0.0.0.0/0 → Internet GatewayThis makes the subnet public, but an instance still needs a public IP and an appropriate security-group rule before the Internet can reach it. In this lab, only the WireGuard gateway receives a public address.
The private application subnet does not have a default Internet route. It only has the VPC-local route and this return route:
10.10.0.0/16 → WireGuard gateway network interfaceThis route is important because the application sees the original local source address, such as 10.10.10.10. When it replies, AWS needs to know that all 10.10.0.0/16 traffic must go back through the WireGuard gateway.
I also disabled EC2 source/destination checking on the gateway. Normally, AWS expects an EC2 instance to send and receive only its own traffic. A router forwards traffic for other machines, so the gateway needs this check disabled.
Security groups and host firewalls
I used security groups as the AWS-side network boundary.
The private application allows:
- User VLAN
10.10.10.0/24to HTTPS port443 - Management VLAN
10.10.30.0/24to HTTPS port443 - Management VLAN to SSH port
22 - Management VLAN to ICMP for testing
There are no rules for the Guest VLAN, so Guest traffic is denied. The private application also has no public IP, so it cannot be reached directly from the Internet.
Security groups are only one layer. I also configured default-deny nftables policies on edge-fw1 and the AWS WireGuard gateway. This lets the lab enforce the same policy at multiple points instead of depending entirely on AWS security groups.
Building the WireGuard tunnel
WireGuard creates an encrypted point-to-point tunnel between the local edge firewall and the AWS gateway.
The tunnel uses:
Local edge-fw1: 10.254.0.1/30
AWS gateway:    10.254.0.2/30
The local peer routes 10.50.0.0/16 through WireGuard. The AWS peer routes 10.10.0.0/16 back through the tunnel.
Terraform bootstraps the AWS gateway, enables IP forwarding, generates its WireGuard keys, and enables AWS Systems Manager. My configure-hybrid.sh script then:
- Generates the local WireGuard key if one does not already exist.
- Retrieves the AWS public key through Systems Manager.
- Creates the peer configurations.
- Starts WireGuard on both sides.
- Applies the default-deny nftables policies.
- Adds the AWS VPC route to
edge-fw1.
The private keys are never committed to Git.
edge-fw1 redistributes only the approved 10.50.0.0/16 AWS route into OSPF. This allows core1 to learn how to reach AWS through edge-fw1. OSPF itself does not cross the WireGuard tunnel; it remains inside the local lab.
The private application
The private EC2 instance runs a small Python HTTPS service using a self-signed certificate. It is managed by systemd and starts automatically when the instance boots.
The service intentionally listens only inside the VPC. The goal is not to create a public website. The goal is to prove that an internal user can securely reach a private cloud workload across an encrypted hybrid connection.
Automated hybrid testing
I created validate-hybrid.sh to verify both successful and blocked paths.
The script checks that:
- The WireGuard interface exists.
- A WireGuard handshake completed.
edge-fw1has a route to10.50.0.0/16.core1learned the AWS route through OSPF.- The hybrid firewall uses a default-drop policy.
- User VLAN HTTPS access to the private application succeeds.
- Management ICMP access succeeds.
- Guest access to the private application fails.
- User ICMP access fails.
- The private application has no public IPv4 address.
The completed test produced:
Passed: 11
Failed: 0
The local lab also passed all 44 of its acceptance tests.
A problem I found after restarting the lab
After restarting the Linux laptop, Docker showed the router containers as running, but the hybrid tests failed. core1 and edge-fw1 were missing their Containerlab-created data interfaces.
This happened because Docker restarted the containers, but Docker alone does not rebuild Containerlab’s virtual links. The containers existed, but some of their virtual network cables did not.
Running only the WireGuard configuration script could not fix this because the local OSPF transit link was still missing.
The proper recovery was:
./tests/redeploy-hybrid.shThis script:
- Destroys the incomplete local topology.
- Archives the previous monitoring logs.
- Rebuilds the custom images.
- Deploys a fresh Containerlab topology.
- Runs all 44 local tests.
- Recreates the WireGuard configuration.
- Waits for WireGuard and OSPF to converge.
- Runs all 11 hybrid tests.
After the clean redeployment, all 55 tests passed. This was a useful reminder that a container being “running” does not necessarily mean the complete network topology is healthy.
Verifying SOC visibility across the hybrid network
Now we can start the SOC part of this lab.
The first step is checking if the sensor processes are still active. They should be, since the validation script did not return any errors:
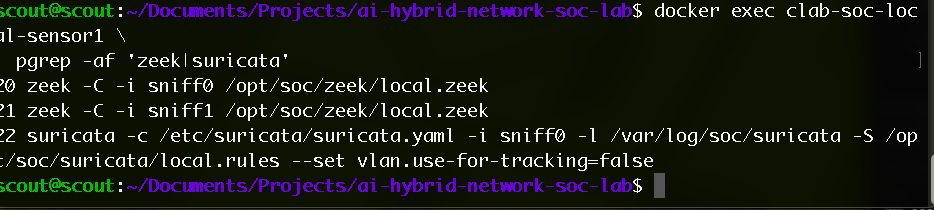
Both Zeek and Suricata look good.
Observing the AWS HTTPS connection
Now let’s try an AWS HTTPS connection request from the local user within VLAN 10:
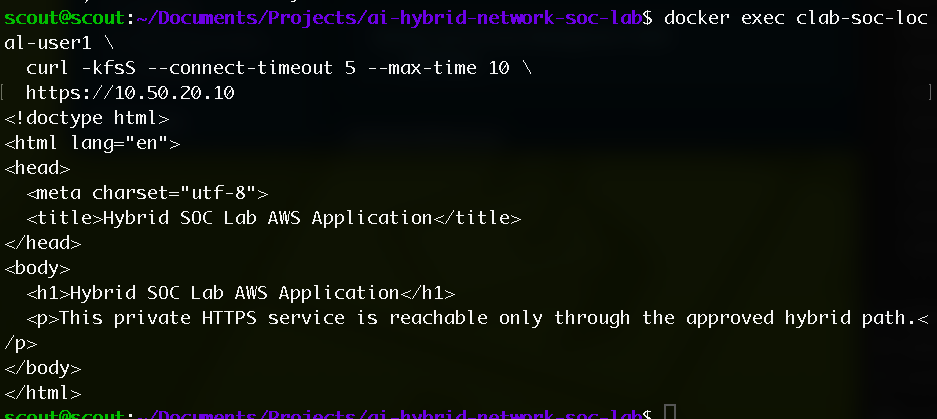
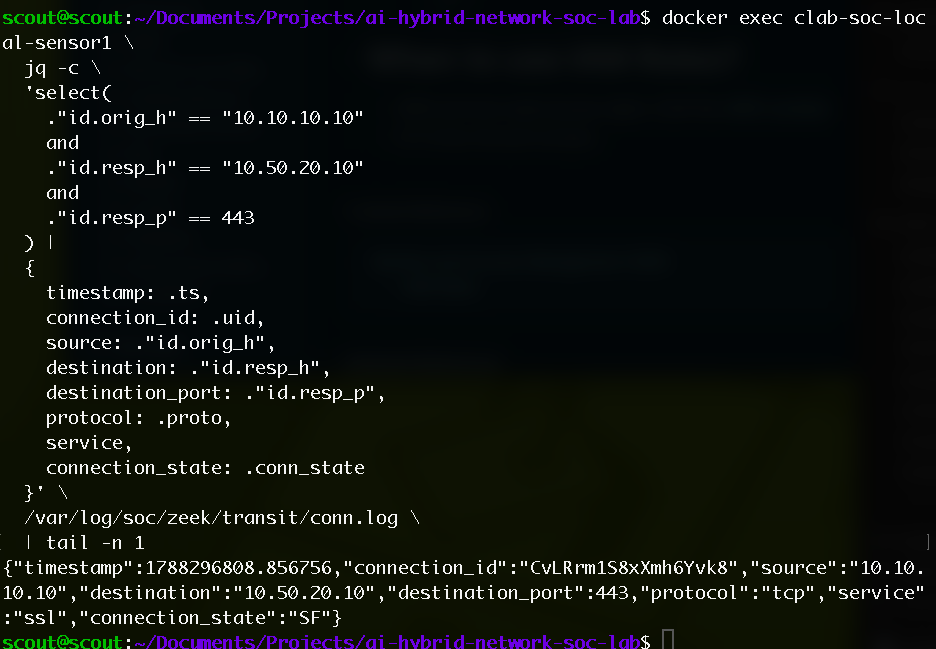
Now, if we look within the sensor, we will see that Zeek successfully managed to record the request:
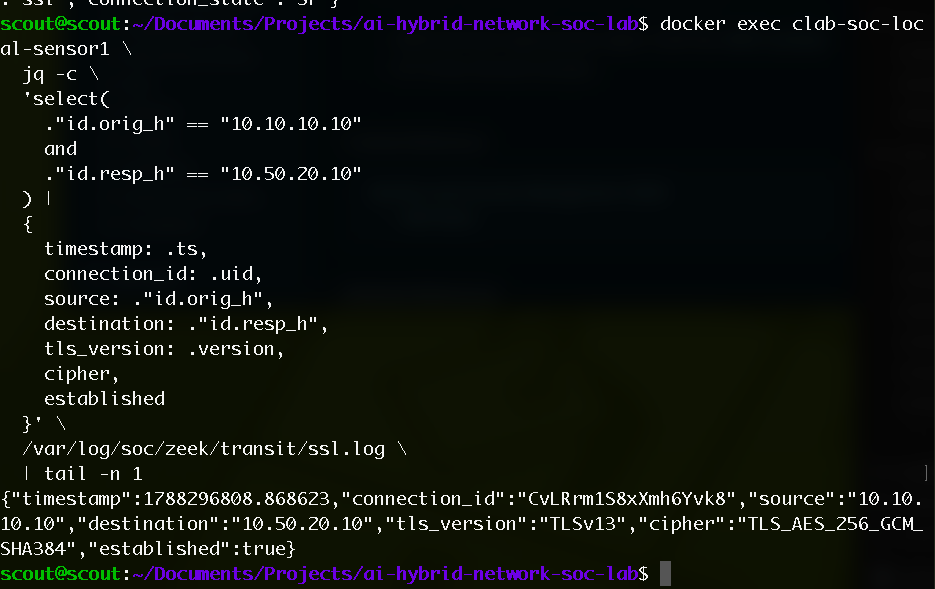
We can also look at the TLS records to see if they match.
Again, since this is encrypted, we cannot see the contents of the packet, but we can see which host initiated it, which server it contacted, when it happened, and which port and protocols were used.
This is known as side-channel leakage.
Checking allowed and blocked traffic
Next, I attempted to generate one allowed and one blocked Suricata event. The first one is user1 attempting to access our AWS application, and this should go through. The second one is a Guest user attempting to ping the server. Remember that guests are not allowed to use ICMP to ping the server. So this attempt should be blocked:
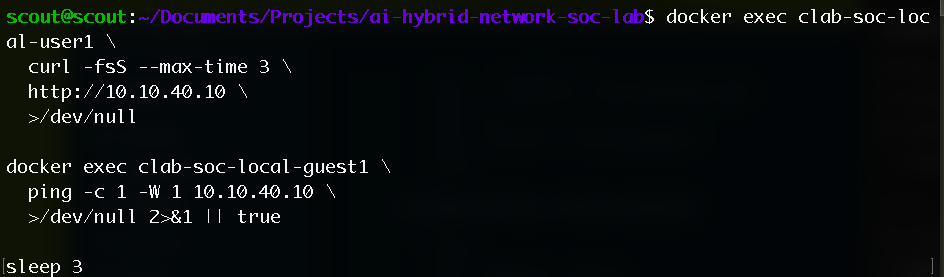
And when I checked the logs, this was indeed blocked:

Comparing packets before and after WireGuard
Now let’s compare the packets before and after WireGuard:
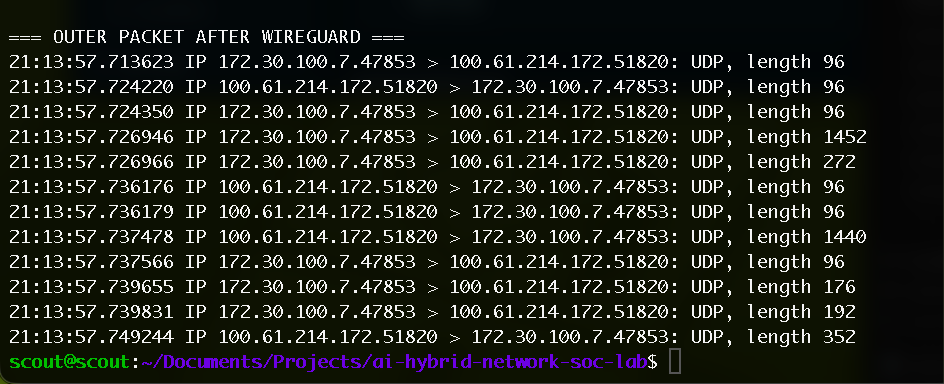
Now I wanted to confirm that WireGuard was actually encrypting the traffic and not just assume it was working because the connection succeeded. I captured the same request in two places while user1 connected to the private AWS application.
Before WireGuard, the sensor could see the original connection from 10.10.10.10 to 10.50.20.10 on TCP port 443, including the TCP handshake and TLS packets. Immediately afterward, the outside interface on edge-fw1 only showed UDP traffic going to the AWS WireGuard gateway on port 51820.
The two captures started only around 33 microseconds apart, so I could correlate the original TCP packet with the encrypted WireGuard packet. The outside capture no longer exposed the User IP, AWS private application IP, or TCP port 443. It only showed encrypted UDP traffic between the WireGuard peers. I redacted the AWS public endpoint from the screenshots.
Before:

After:
Confirming firewall decisions with counters
Now I wanted to check which firewall rule was used to allow a packet. Specifically, I wanted to check if the User-to-AWS HTTPS rule was used. So, before requesting a new connection to the AWS instance:

And after:

The packet count increased by one.
Now for an attempt where the packet is blocked:
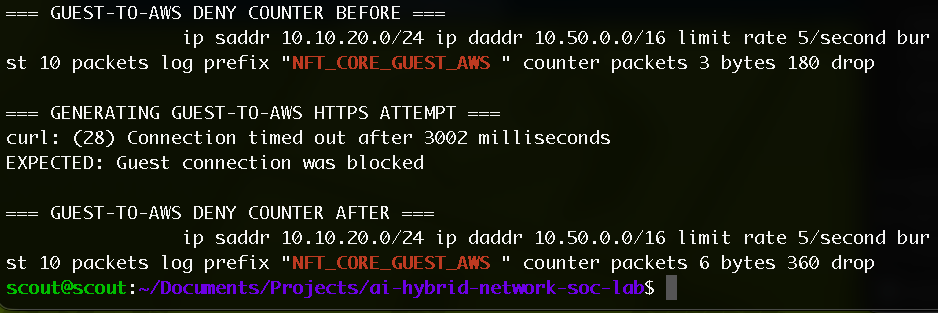
Next I tested what would happen if guest1 tried to reach the private AWS application. I checked the Guest-to-AWS deny counter on core1, generated an HTTPS request from guest1, and then checked the counter again. As seen above, the connection failed and the counter increased, showing that core1 blocked the packet before it reached edge-fw1, the WireGuard tunnel, or AWS. The edge firewall also has a Guest deny rule for defense in depth, but normally it never sees this traffic because core1 drops it first.
Controlled attack simulations
Guest TCP port scan
Next, I want to see what happens if guest1 tries to scan the network using Nmap. We currently don’t have a rule in Suricata blocking this, but we will add one.
During an Nmap scan, the scanner sends out TCP SYN packets to establish connections and determine if the targets are online. We will detect this with a threshold of 5 SYN scans per 10 seconds. If the number of SYNs goes beyond this, it will meet the detection threshold, and we will get an alert.
After adding Nmap to the guest’s image, I checked that it was actually in the image after rebuilding:
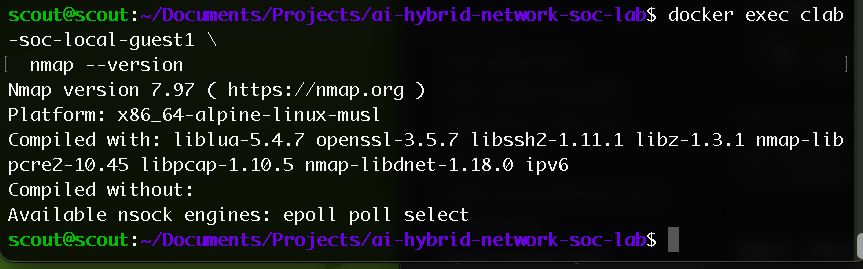
So now we can actually run an Nmap scan and watch it be detected by Suricata and eventually rejected by the core1 router when it hits the Guest-to-internal deny rule.
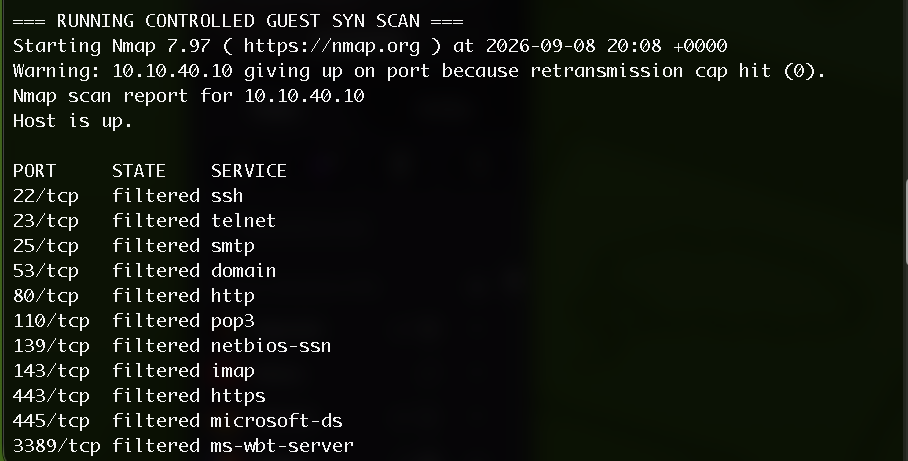
So, as we can see above, the state of each port is “filtered”. This means that Nmap did not receive a usable response back from the port. We do not know whether the port is closed.
And here we can see Suricata working as expected and detecting the attempt with SID 10000003. BTW, Suricata is passive; it doesn’t actually block requests.

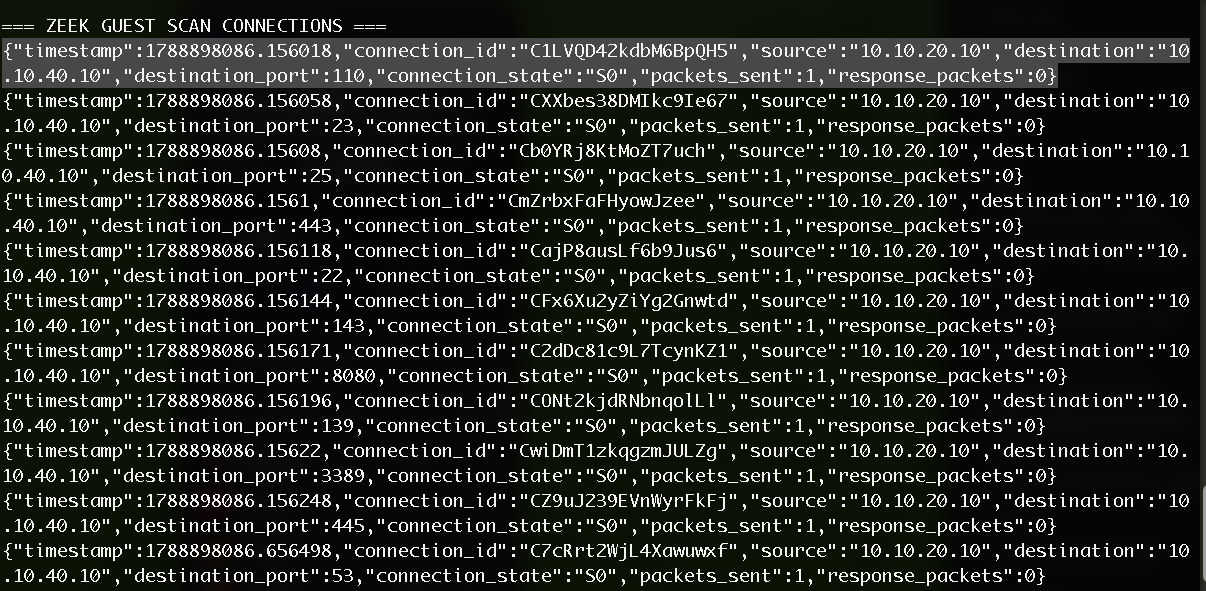
And here we see Zeek detecting the TCP requests to the server. But notice that there are no response packets. This again shows that the core1 router is blocking the request from reaching the server in the first place.
SSH password guessing
After the guest scan scenario, I wanted to simulate what could happen if an attacker compromised an administrative workstation and started guessing passwords for an internal server.
For this scenario, admin1 represents the compromised administrative endpoint and server1 is a local server in the Server VLAN. This did not involve the AWS environment.
The path was:
admin1 10.10.30.10
  → sw1
  → core1
  → server1 10.10.40.10:22
This path is intentionally allowed by the firewall because the Management VLAN is supposed to administer infrastructure. That is what makes the scenario useful: the network firewall cannot block every SSH connection from an authorized admin network, so I needed to see how the server and SOC monitoring tools handled suspicious authentication behavior.
First, I added SSH to server1 and created a disposable socops account. Its password is randomly generated each time the lab deploys, so it is never stored in Git or known to the attack script.
Next, I used sshpass on admin1 to send six deliberately wrong passwords to server1. The goal was not to gain access. Every login was expected to fail.
I wanted to understand what each monitoring layer could actually prove:
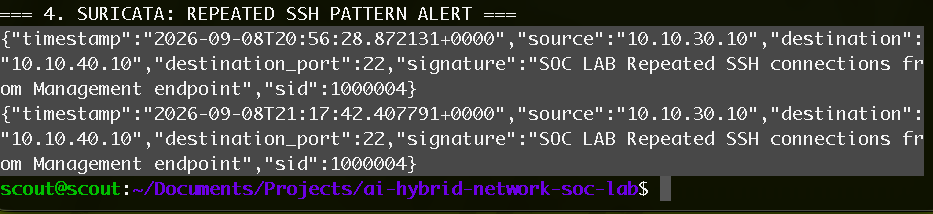
- Suricata detected the repeated TCP/22 connection pattern and generated SID
1000004. - Zeek recorded the network sessions between
admin1andserver1. - The SSH daemon log on
server1provided the strongest evidence because it showed the actual failed-password events.
Something that stood out to me was that the first four attempts and the final two attempts looked different.
The first four connections completed an SSH handshake and reached password authentication. The server logged Failed password for each one.
After those repeated failures, OpenSSH applied a built-in per-source penalty against admin1’s IP address. The final two connections were dropped before a password was processed. This was not the firewall blocking SSH; it was the SSH service on server1 rate-limiting a source that had already failed authentication multiple times, as seen below:

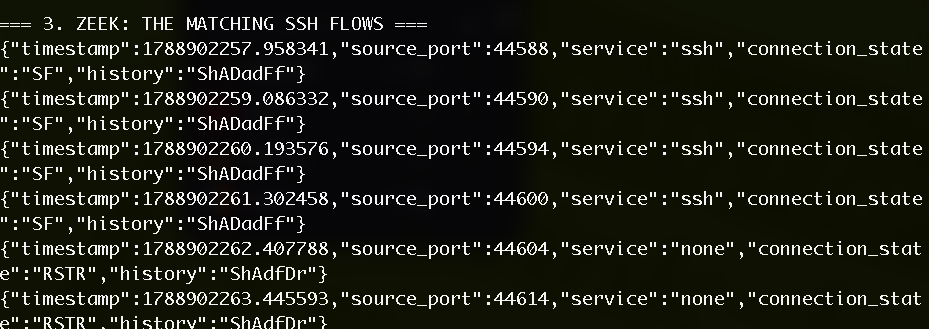
Zeek supported this conclusion. The first four connections were identified as SSH sessions with a completed TCP state. The final two had no detected SSH service and showed a reset connection state. The source ports in Zeek matched the source ports named in the server’s penalty-drop logs.
This helped me understand why SOC investigations need multiple evidence sources. Suricata showed the repeated connection pattern, Zeek showed the network behavior, and the host log explained exactly why the final two sessions were rejected. A network alert alone would not have told the full story.
AI normalization and analysis
After collecting evidence from Zeek, Suricata, and the SSH server, I learned that each tool describes the same activity differently. Zeek focuses on connections, Suricata generates alerts, and sshd records what happened during authentication.
I created a Python normalization layer to convert these logs into one common event format. Each event receives a stable event ID, a reference to the original log entry, and a hash that can be used to verify the evidence.
Python then correlates the events into incidents. It calculates the important facts before the AI sees anything, including:
- Connection attempts
- Scanned ports
- Failed passwords
- Dropped sessions
- Successful authentications
I used OpenRouter’s free endpoint for the AI portion. Only the structured incident was sent to the model, not the original raw logs. The AI’s job was to turn the calculated facts into a readable incident report and recommend investigation steps.
OpenRouter setup and validation hiccups
I ran into a few problems during this experiment. My first request was rejected because my OpenRouter privacy settings did not allow the free providers to use submitted data for training. After changing that setting, the request worked as expected.
The first generated report was then rejected by my own validator. The AI returned the affected asset as server1 (10.10.40.10), even though the only permitted value was server1. I updated the structured-output schema so the model could only select exact host names and evidence IDs from the incident.
After that change, OpenRouter successfully generated two reports and both passed the automatic validator. Interestingly, the free router selected a different AI model for each report. This showed me that using a free model router does not always produce consistent results. You get what you pay for.
Human review of the AI reports
Human review still found problems that the validator missed:
- The AI called the firewall on
core1a perimeter firewall. - It suggested checking
server1for traffic that had already been blocked before reaching it. - It described a Zeek connection event as a Suricata alert.
The event ID was real, so the validator accepted it, but the AI described the evidence incorrectly. This showed me the difference between validating that evidence exists and understanding what that evidence actually means.
What I learned
My biggest takeaway was that the AI should assist the analyst, but it should never become the source of truth. Python established the facts, the validator caught unsupported values, and the human analyst still had to review the final meaning of the report.